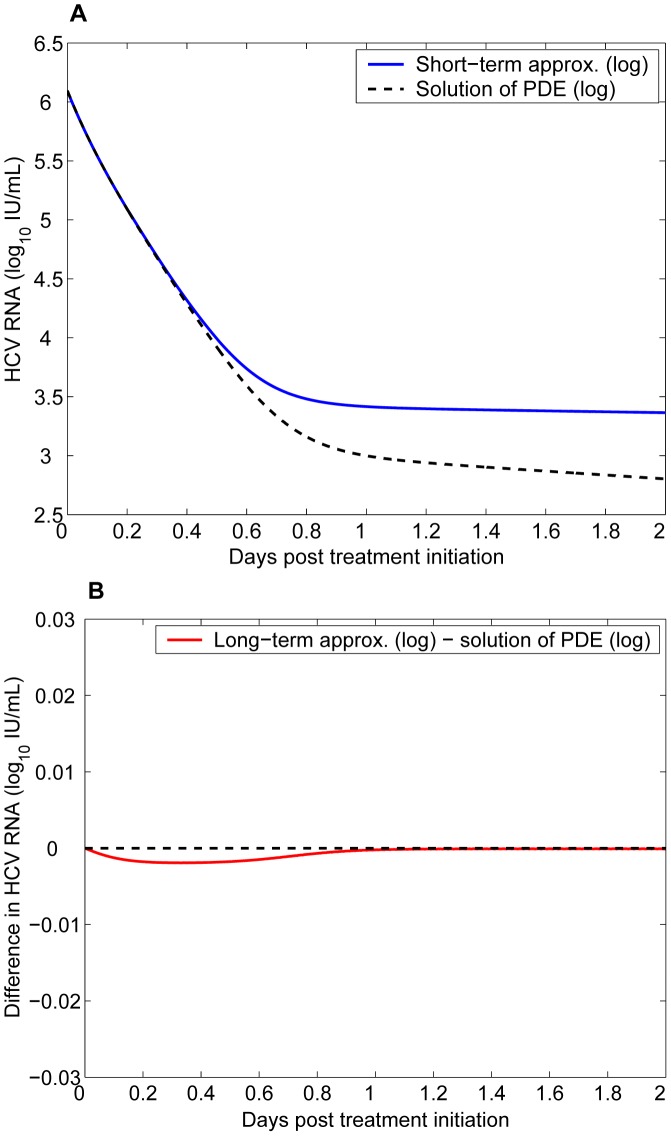
Figure 2. The approximate and the numerical solutions of the multiscale model.
A. The short-term approximation (blue solid) is compared with the solution of the multiscale PDE model (black dashed). B. Difference between the long-term approximation and the solution of the multiscale PDE model. Parameter values, chosen from Table 2 and [30], are  ,
,  ,
,  ,
,  ,
,  ,
,  ,
,  ,
,  ,
,  ,
,  ,
,  ,
,  , and
, and  .
.

