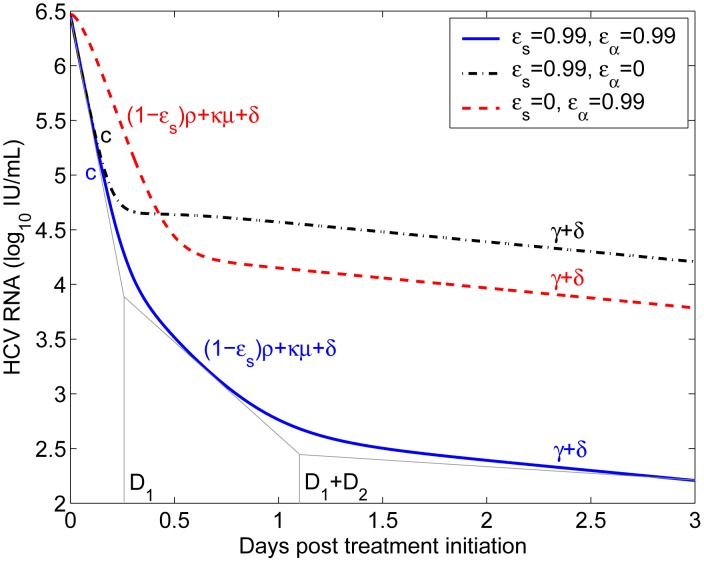
Figure 3. Phases of viral decline affected by the effectiveness of therapy in blocking intracellular viral production and assembly/secretion.
When therapy significantly blocks both intracellular viral production ( ) and assembly/secretion (
 ), the viral load decline has three phases (blue solid), with slopes
  ,
,  , and
, and  , respectively. The duration of the first phase (
 ) is about 0.25 days and the duration of the second phase (
 ) is about 0.88 days using the parameter values below. When
  , the first-phase viral decline with the slope
  is not visible (red dashed). When
  , the second-phase viral decline is not visible (black dash-dotted). Parameter values
  ,
,  ,
,  ,
,  ,
,  ,
,  ,
,  ,
,  , and
, and  are from Table 2. Because
  was chosen to be 0, when comparing the predicted duration of the first phase in this figure with clinical data one may want to add the length of the pharmacological delay to
  .
.

