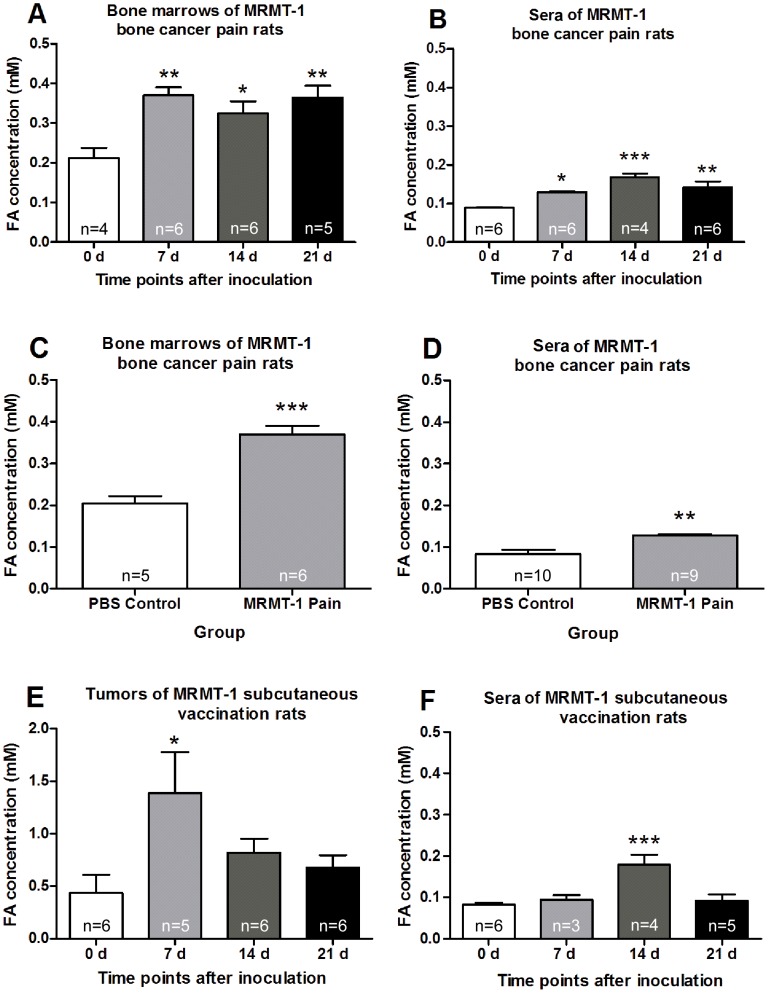
Figure 2. Measurement of formaldehyde concentration in different tissues.
(A) and (B) Bone marrows of the tibia bone and sera at different times after MRMT-1 inoculation in cancer pain rats. (C) and (D) Bone marrows of the tibia bone and sera at day 7 in MRMT-1 cancer pain rats or PBS control rats. (E) and (F) Tumors and sera at different times after MRMT-1 subcutaneous vaccination in rats. * p<0.05, ** p<0.01, *** p<0.001, compared with day 0 group or PBS 7 d group.

