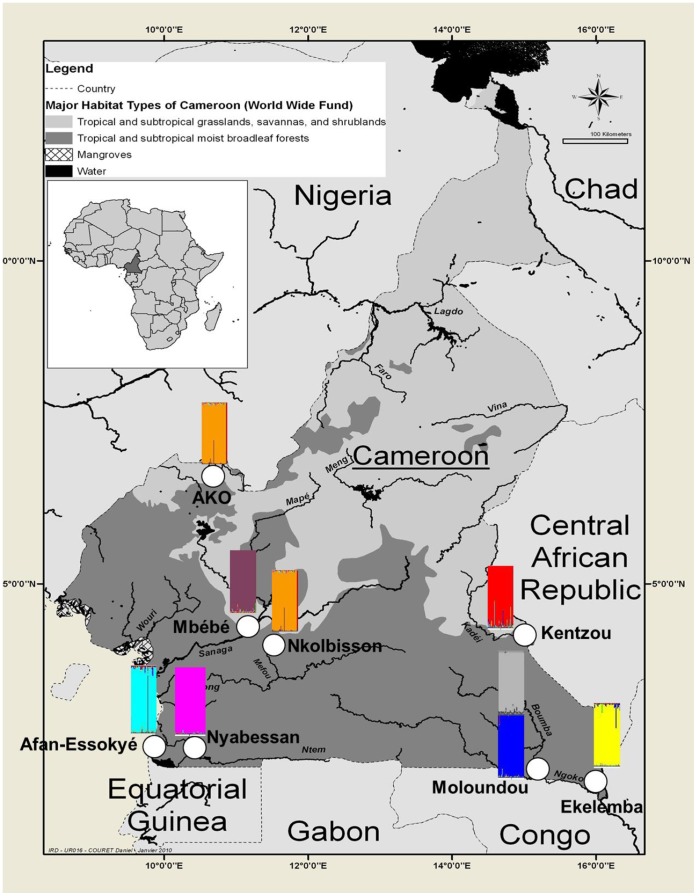
Figure 1. Map of Cameroon showing collection sites and the 8 microsatellites clusters detected by Bayesian clustering analysis using STRUCTURE.
Each colored rectangle represents a distinct genetic cluster within which each vertical bar corresponds to a single individual. Note that Ako and Nkolbisson specimens belong to the same genetic cluster (see text).

