
Figure 4.
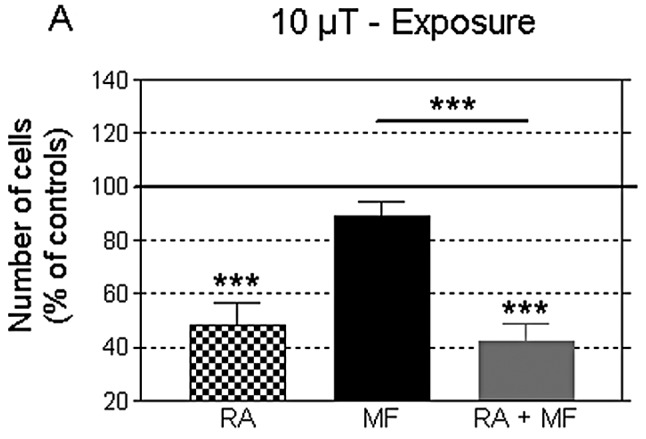
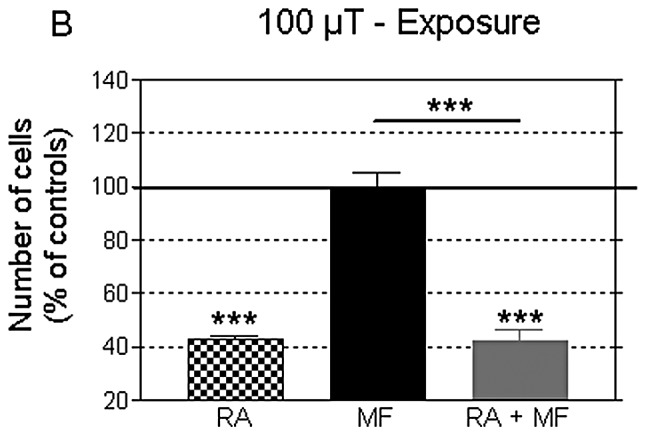
Cell number at the end of day 7 following the different testing conditions: controls (sham), RA, MF and combined treatment with RA+MF. The MF-exposed group was treated intermittently for 90 h, starting at day 3 post-plating. In the RA-treated groups the medium was supplemented with 2 μM RA at days 0 and 3 post-plating. (A) Exposure to MF at 10 μT; n=4 experimental replicates; 20 dishes per replicate and condition. (B) Exposure to MF at 100 μT; n=5 experimental replicates; 20 dishes per replicate and 25 dishes per condition. Data were normalized according to the values of the sham-exposed controls and expressed as the means ± SEM. ***P≤0.001 (ANOVA followed by unpaired Student’s t-test).