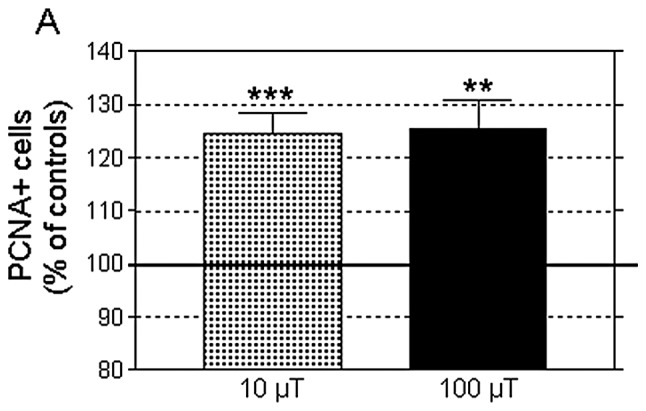
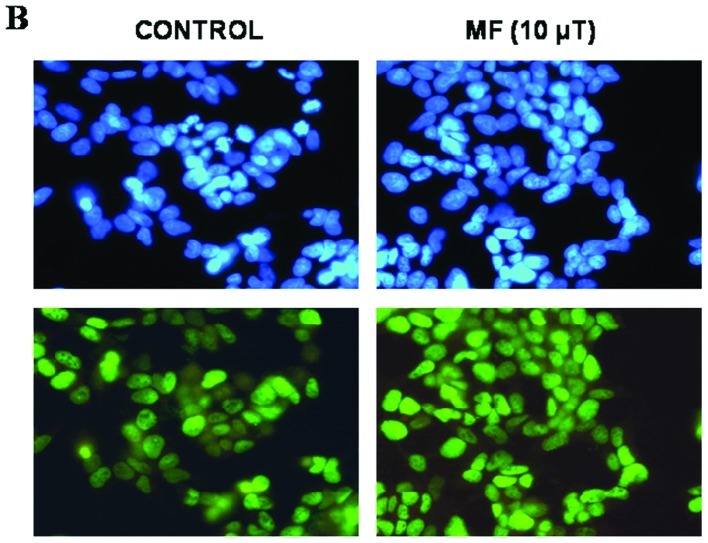
Figure 6.

(A) PCNA-positive (PCNA+) cells at the end of day 5 in samples intermittently exposed to MF and/or incubated for 42 h. Data were normalized to sham-exposed controls and expressed as the means ± SEM of 8 and 3 experimental replicates, at 10 and 100 μT, respectively. **P<0.01, ***P<0.001 (ANOVA followed by the Student’s t-test). (B) Representative example of immunostaining in controls and MF-exposed cells (10 μT). PCNA+ cells (lower panels) and Hoechst nuclear staining (upper panels). The PCNA+ rate was calculated as the number of cells expressing PCNA divided by the number of Hoechst-stained nuclei (total cell number).

