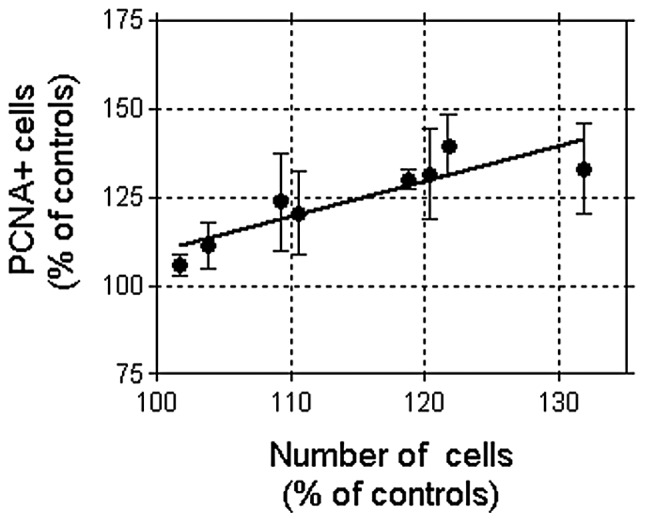
Figure 7.

Linear correlation between the fraction of PCNA-positive cells and the total cell number, after 42 h of exposure to a 50-Hz MF at 10 μT. Each data point in the figure represents the mean ± SD of 8 dishes corresponding to each of 8 experimental replicates. Data were normalized to the corresponding sham-exposed controls (8 dishes per replicate). Pearson’s r=0.8832; P<0.01.
