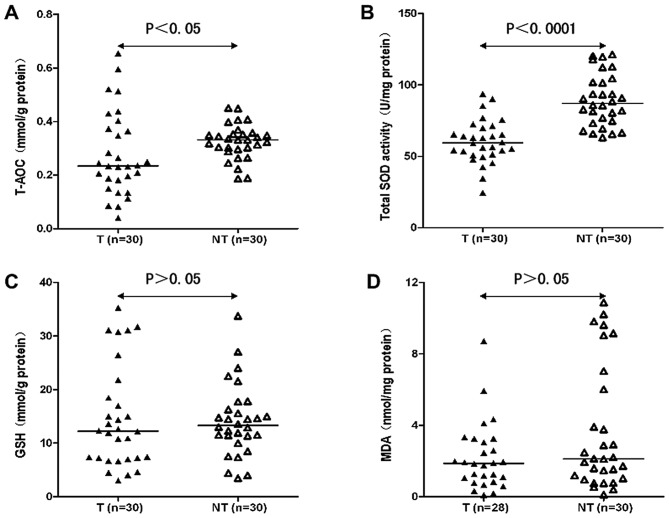
Figure 1.
Comparison of oxidative stress parameters in HCC tissues (T) and non-tumor tissues (NT). (A) The T-AOC in T was lower than in NT. (B) The activity of total SOD in T was significantly lower than in NT. (C) The GSH content was not different between T and NT. (D) The content of MDA was not significantly different between T and NT. Black line represents median.

