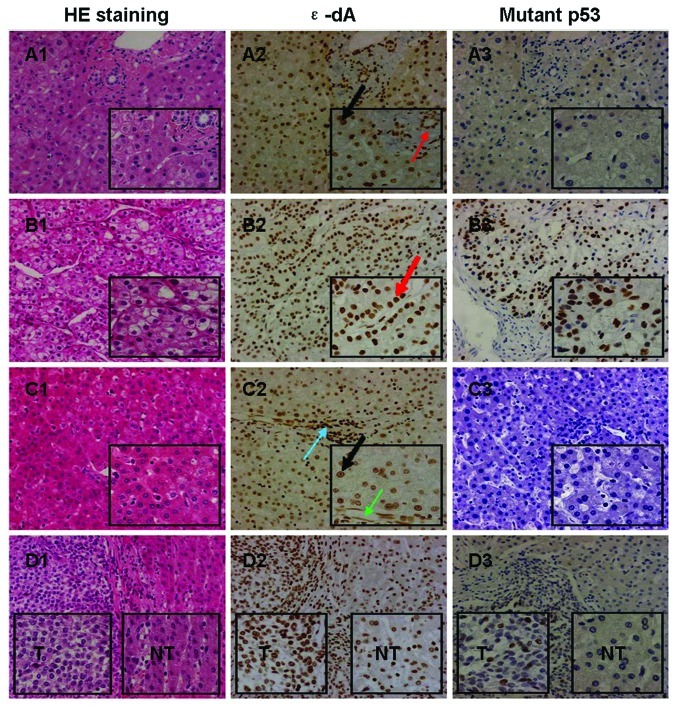
Figure 3.
ɛ-dA and mutant p53 protein expression in liver tissues. (A) Patient no. 36: many ɛ-dA-positive cells (A2) were present in the adjacent liver tissue of chronic granulomatous inflammation (A1), but mutant p53 had a negative expression (A3). The thick black arrow shows the nuclear expression of ɛ-dA in hepatocytes; the thin red arrow shows the nuclear expression of ɛ-dA in bile duct epithelial cells. (B and C) Patient no. 39: many ɛ-dA-positive cells (B2 and C2) were present in HCC (B1) and non-tumor liver tissue (C1, >2 cm in distance from the tumor margin), and mutant p53 had a positive expression in HCC (B3), but a negative expression in non-tumor liver tissue (C3). The thick red arrow shows the nuclear expression of ɛ-dA in cancer cells; the thick black arrow shows the nuclear expression of ɛ-dA in hepatocytes; the thin blue arrow shows the nuclear expression of ɛ-dA in infiltrating lymphocytes; the thin green arrow shows the nuclear expression of ɛ-dA in vascular endothelial cells. (D) Patient no. 35: many ɛ-dA-positive cells (D2) were present in hepatosarcoma and adjacent non-tumor liver tissue (D1), and mutant p53 had a positive expression in hepatosarcoma (D3), but a negative expression in adjacent non-tumor liver tissue (D3). T, HCC tissue; NT, non-tumor liver tissue. Original magnification ×200 and ×400.

