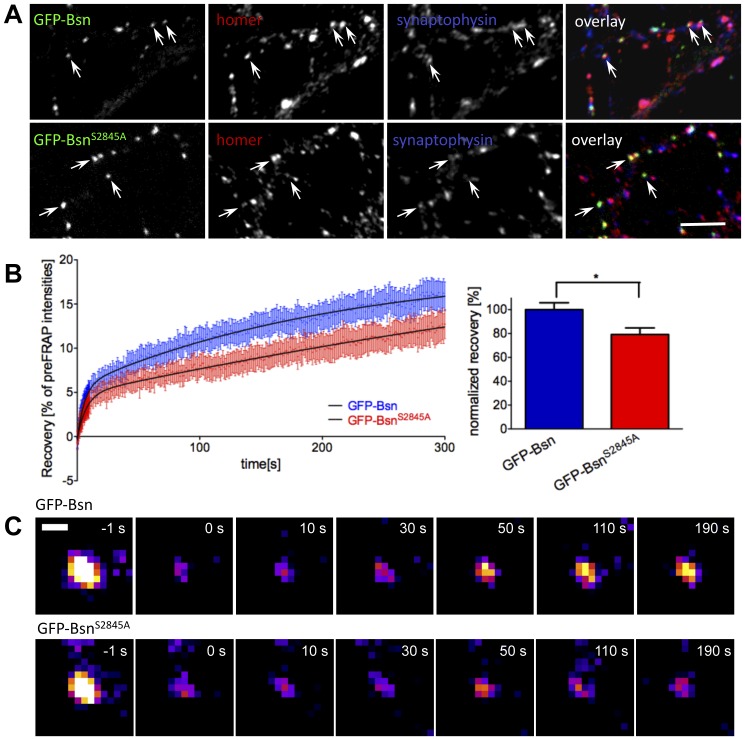
Figure 7. Analysis of molecular dynamics of GFP-Bsn and GFP-BsnS2845A by FRAP. (A).
Primary hippocampal neurons were transfected with GFP-Bsn or GFP-BsnS2845A at DIV3 and analyzed at DIV 14-16. Synaptic targeting of both constructs was assessed by co-staining with synaptic markers homer and synaptophysin. The arrows highlight synapses of transfected cells stained for both markers. Scale bar, 20 µm. (B) Curves in the left panel show averaged fluorescence recovery of all analyzed puncta plotted as actual spot intensity relative to pre-bleaching intensity. The whiskers show SEM for each value. GFP-Bsn (wild-type) shows a higher recovery rate compared to GFP-BsnS2845A. Recovery was significantly lowered for GFP-BsnS2845A 300 s after photobleaching. Columns in right plot represent mean value normalized to GFP-Bsn recovery, whiskers SEM, * indicates P<0.05. The values were obtained from 4 independent imaging sessions. (C) Representative example image showing bleaching and recovery of a GFP-Bsn and GFP-BsnS2845A puncta. Scale bar is 1 µm.

