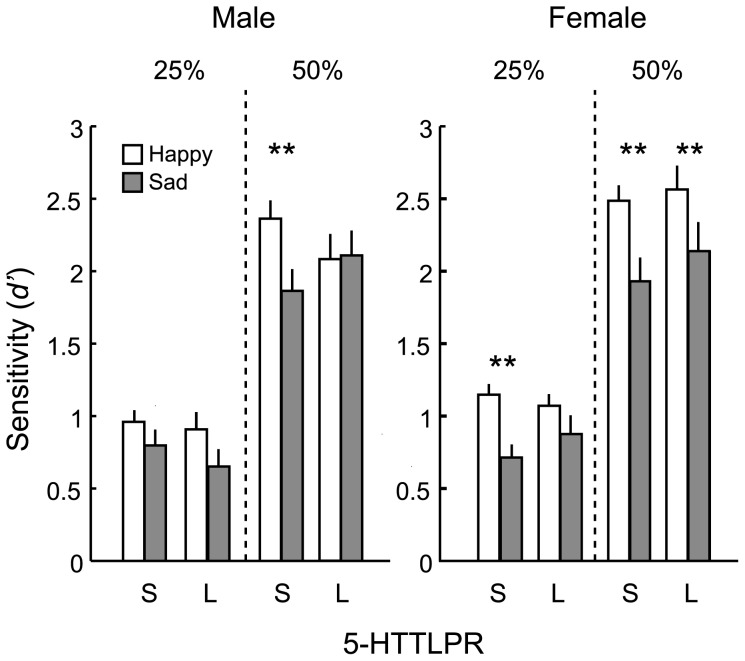
Figure 2. Mean sensitivity (d′) to happy and sad facial expressions at two intensities (25% and 50%).
Means are shown separately for each demographic group among males (left) and among females (right). The error bars denote the standard errors of the means. The asterisks indicate the significance of the positivity advantage (i.e., significant difference in d′ between happy and sad facial expressions: **p<0.1).

