
Figure 1. Abundance of Trypoxylon figulus in relation to landscape parameters.
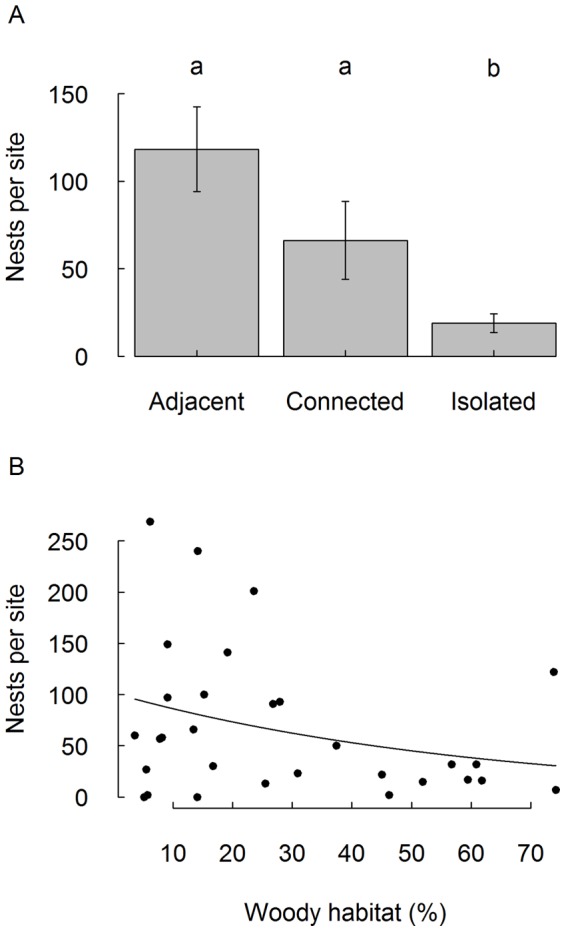
a) Local habitat isolation, b) Amount of woody habitat in the landscape (Poisson regression line: y = exp(4.62 −0.016x)). Error bars indicate standard error of the mean. Significant differences are represented by different letters (Tukey’s test, P ≤ 0.05). Nests refer to the mean number of occupied nesting tubes.