
Figure 3. Structural equation modeling relating landscape parameters to the different trophic levels.
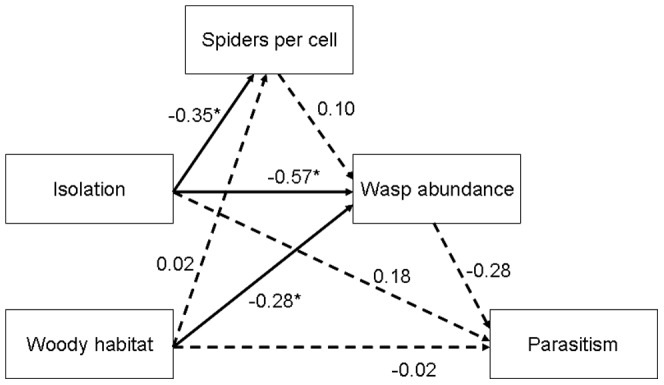
The model shows all possible direct and indirect relationships between landscape parameters (local isolation and amount of woody habitat), prey abundance (spiders per cell), predator abundance (number of occupied nesting tubes), and predator parasitism rate. Standardized path coefficients are given next to the arrows (*P ≤ 0.05). Dotted arrows represent non-significant paths. Woody habitat: amount of woody habitat (%); Parasitism: proportion of parasitized brood cells.