
Figure 1.
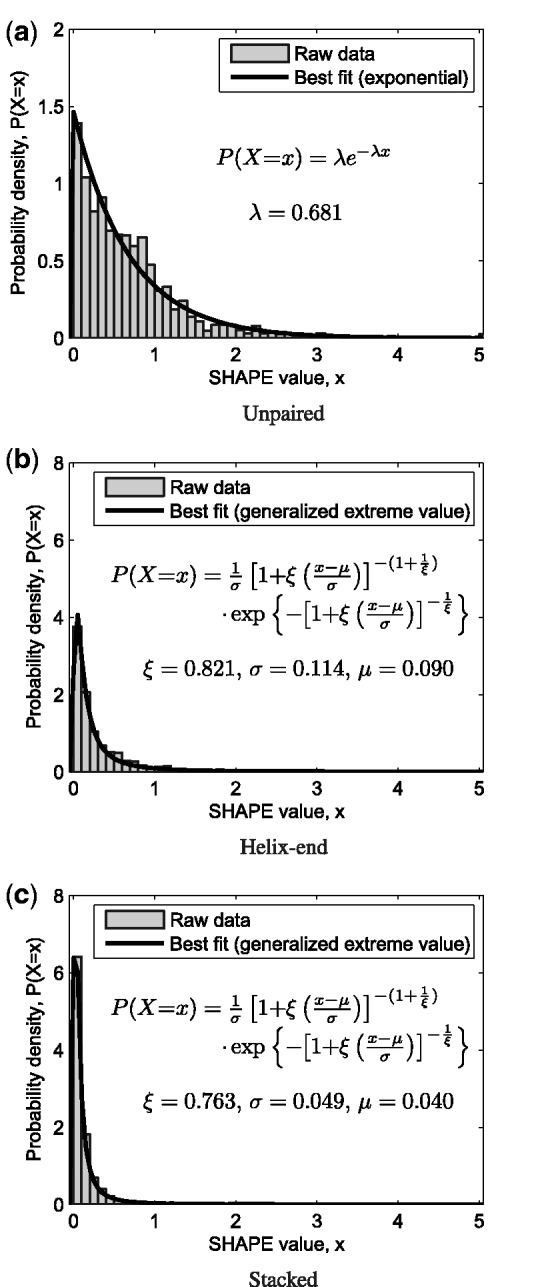
Ternary model distinguishing (a) unpaired, (b) helix-end and (c) stacked nucleotides. Maximum likelihood probability density functions fit to the experimental data set are given. SHAPE data for E. coli 16S and 23S ribosomal sequences are shown in normalized histograms. Vertical scale on the two paired distributions is four times that of the unpaired.