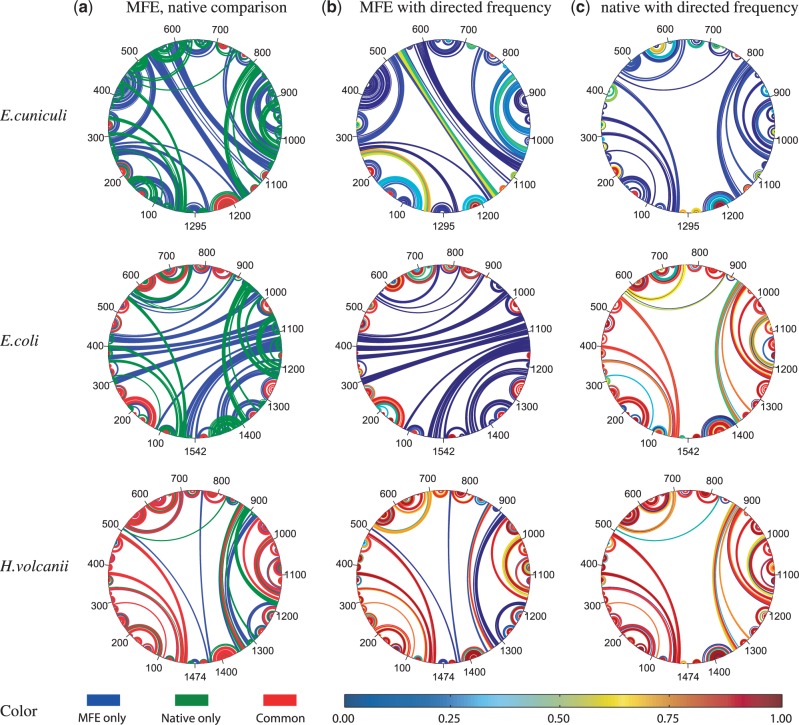
Figure 4.
Circular arcplots of E. cuniculi, E. coli and H. volcanii 16S secondary structures. Sequence is drawn as a circle, and each arc denotes a base pair. Column (a) shows an overlay of MFE (blue) and native (green) structures with common base pairs in red. Column (b) shows the MFE structure with base pairs annotated by the fraction of data-directed structures also containing that pair, as indicated by the color bar at the bottom. Column (c) show the native structure likewise annotated.

