Figure 1.
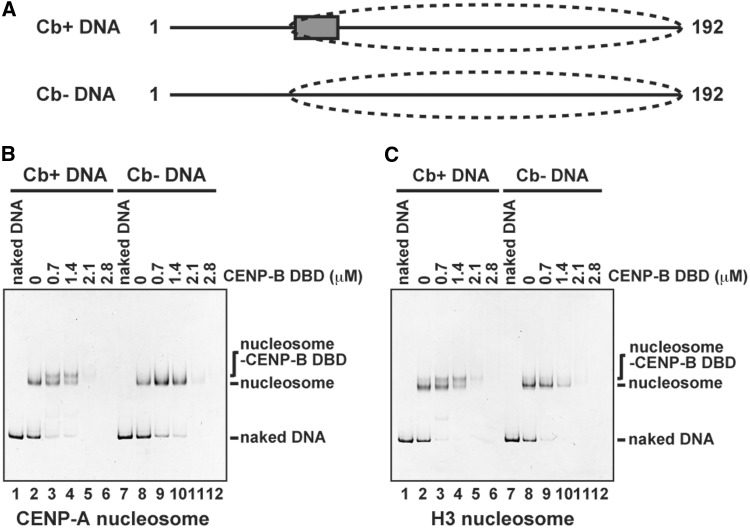
Specific and non-specific CENP-B DBD binding to the CENP-A and H3 nucleosomes. (A) Schematic representations of 192-bp α-satellite DNAs. The box and the dashed circle indicate the location of the CENP-B box and the nucleosome positioning, respectively, as revealed by the previous MNase mapping (42). (B) CENP-B DBD binding to the CENP-A nucleosomes with or without the CENP-B box DNA. The CENP-A nucleosomes (140 nM) with the CENP-B box sequence (Cb+) (lanes 2–6) or without the CENP-B box sequence (Cb−) (lanes 8–12) were incubated with the CENP-B DBD for 20 min at 37°C. CENP-B DBD concentrations were 0 µM (lanes 2 and 8), 0.7 µM (lanes 3 and 9), 1.4 µM (lanes 4 and 10), 2.1 µM (lanes 5 and 11) and 2.8 µM (lanes 6 and 12). The samples were analyzed by non-denaturing 5% polyacrylamide gel electrophoresis, followed by ethidium bromide staining. Lanes 1 and 7 indicate the 192-bp naked DNA. (C) CENP-B DBD binding to the H3 nucleosomes with or without the CENP-B box DNA. The H3 nucleosomes (140 nM) with the CENP-B box sequence (Cb+) (lanes 2–6) or without the CENP-B box sequence (Cb−) (lanes 8–12) were incubated with the CENP-B DBD for 20 min at 37°C. CENP-B DBD concentrations were 0 µM (lanes 2 and 8), 0.7 µM (lanes 3 and 9), 1.4 µM (lanes 4 and 10), 2.1 µM (lanes 5 and 11) and 2.8 µM (lanes 6 and 12). The samples were analyzed by non-denaturing 5% polyacrylamide gel electrophoresis, followed by ethidium bromide staining. Lanes 1 and 7 indicate the 192-bp naked DNA.

