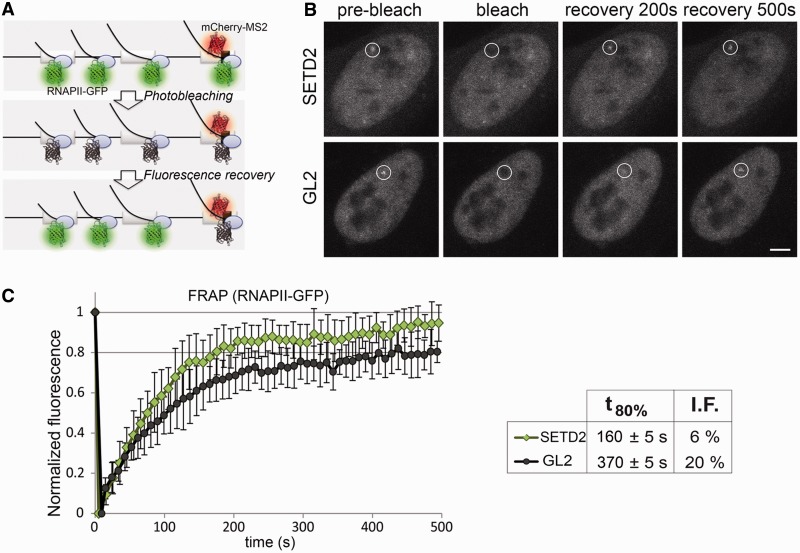
Figure 2.
SETD2 depletion alters the dynamics of RNAPII transcription. (A) Schematic representation of the MS2 system. Dimers of MS2 coat protein fused to mCherry bind to MS2 stem–loops inserted in the third exon of the β-globin gene, while transcription is carried out by α-amanitin–resistant RNAPII–GFP. (B) FRAP experiments were performed on U2OS cells transfected with siRNAs targeting GL2 and SETD2. A circular region corresponding to the site of transcription of the β-globin gene is bleached, and fluorescence recovery is subsequently monitored. Scale bar: 5 µm. (C) Normalized fluorescence recovery curves measured at the transcription site for SETD2-depleted (n = 19) and GL2-depleted (n = 18) cells from four individual experiments. t80% denotes the time required to recover 80% of the initial fluorescence. I.F. indicates the percentage of the immobile fraction of bleached RNAPII–GFP molecules at the site of transcription. Error bars represent standard deviations.

