Figure 6.
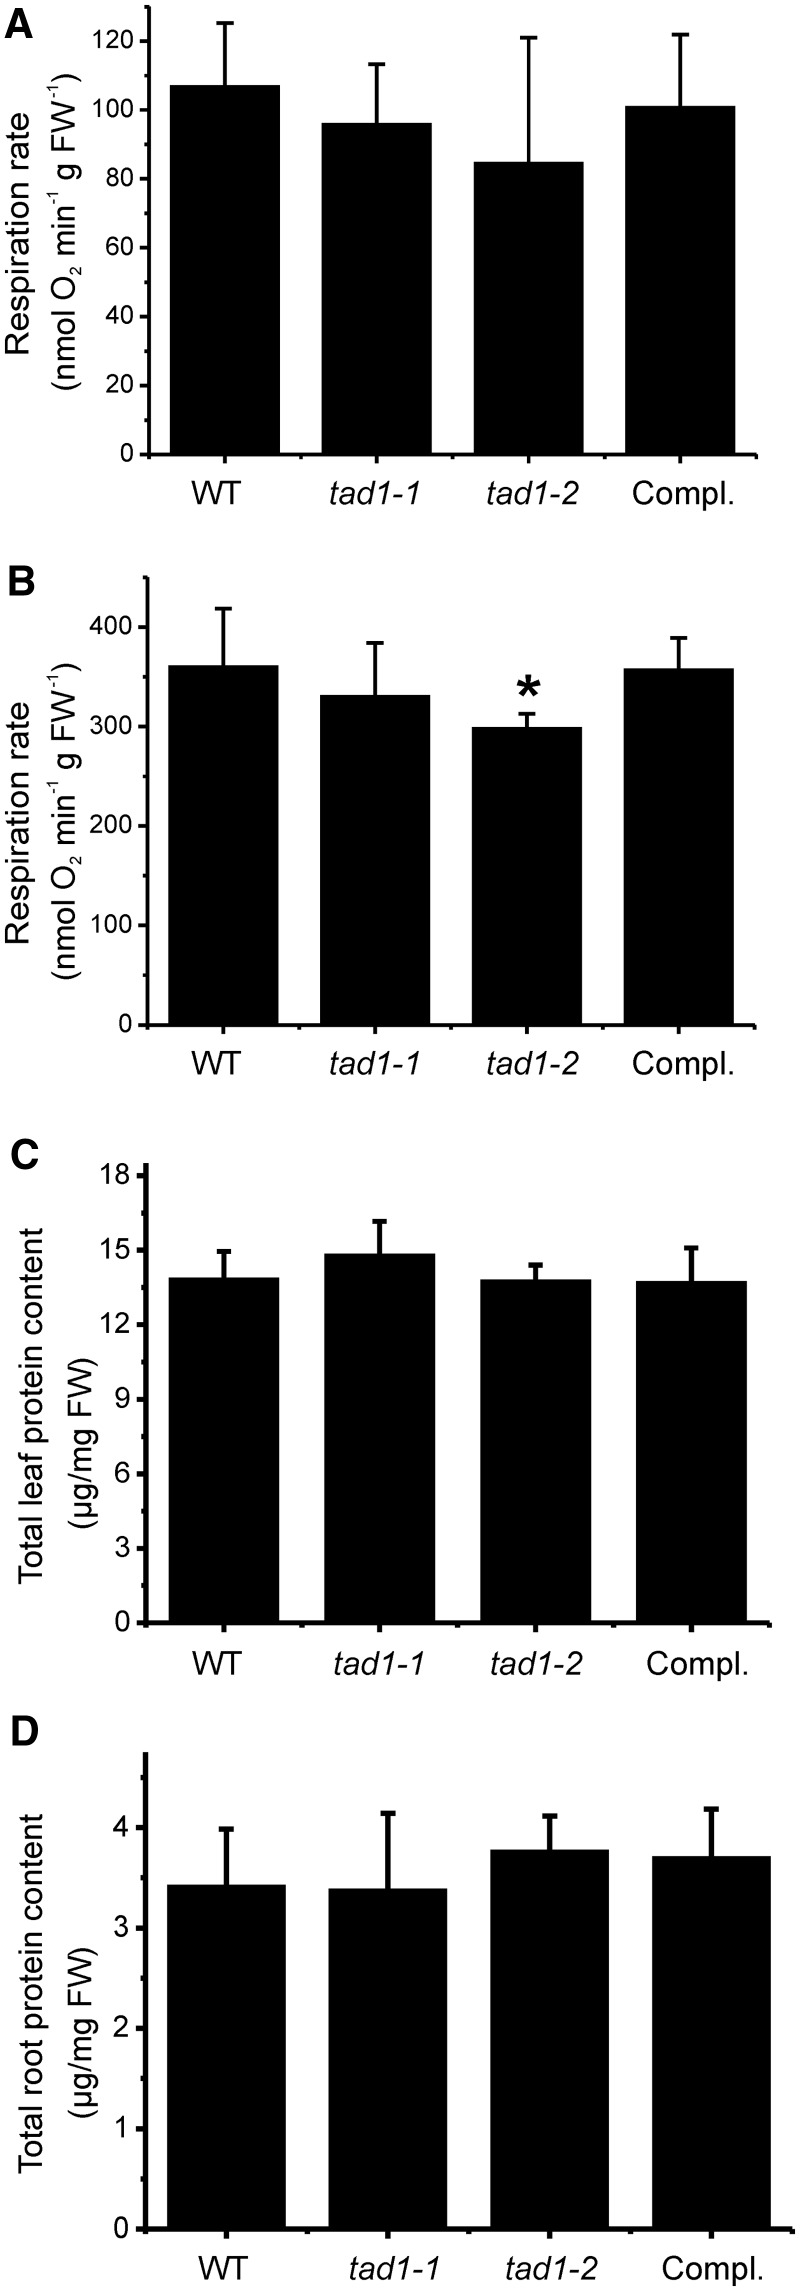
Measurement of respiration activity and total protein content in tad1 mutant plants, wild-type plants (WT) and the complemented tad1-2 line (Compl.). (A) Leaf respiration rates of 30-day-old plants grown under short-day conditions. (B) Leaf respiration rates of cold stressed plants. Twenty-day-old plants grown in soil under short-day conditions were cold stressed at 4°C for 20 days. Respiration was measured in the dark and is given in nanomoles consumed oxygen per minute and gram fresh weight (FW). Error bars represent the standard deviation (n = 8). Asterisks indicate statistically significant differences (P < 0.05) in Student’s t-test. (C) Analysis of total soluble proteins amounts in leaves (n = 6) from cold-stressed plants. (D) Analysis of total soluble proteins amounts in roots (n = 6) from cold-stressed plants.

