Figure 2.
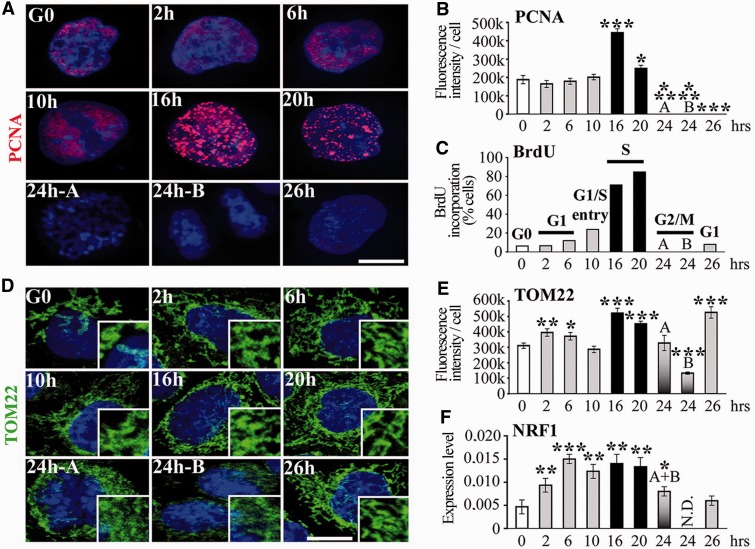
Mitochondrial biogenesis during the cell cycle. (A) 3D-reconstructed HeLa cells synchronized in G0 by serum starvation. Anti-PCNA labelling (red) identifies phase of cell cycle. (B) Fluorescence intensity quantification of PCNA labelling. (C) Percentage of cells that incorporate BrdU (S-phase). Phases of cell cycle are indicated on top of columns. Code colours are constant for the histograms. (D) 3D-reconstructed HeLa cells immunostained with anti-TOM22 (green) to label the mitochondrial network. Cells in G2/M: pre-mitotic ‘A’ and post-mitotic ‘B’, according to the size of the nuclei. Magnification of the mitochondrial network is shown on the right low corner of each time point. (E) Fluorescence intensity quantification of TOM22 labelling. (F) RT-qPCR of mitochondrial biogenesis marker NRF1. n = 3. G2/M ‘A’ and ‘B’ cells cannot be separated in RT-qPCR experiments (single A + B column). t-test, each time point was compared with G0. Scale bars = 10 μm.

