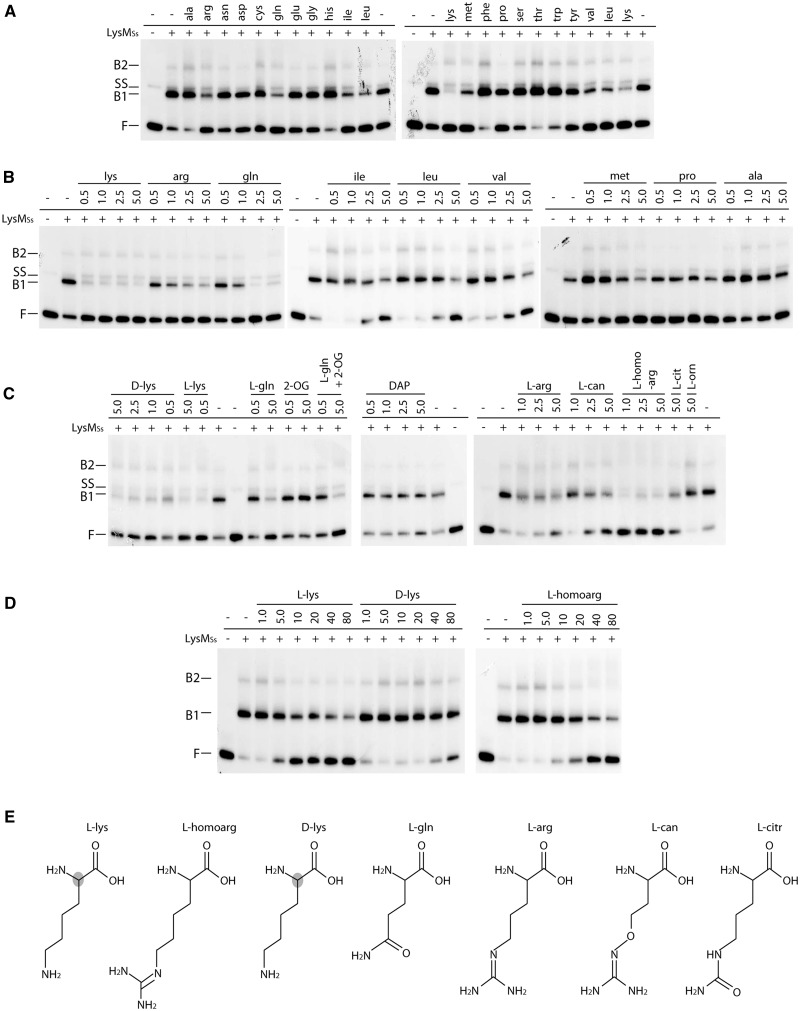
Figure 9.
Effect of different cofactors on LysMSs DNA binding to the gltB control region on a 167-bp fragment monitored by EMSAs. (A) EMSAs to test binding in presence of each of the 20 l-amino acids. Positions of free DNA (F), single-stranded DNA (SS) and LysMSs–DNA complexes (B1 and B2) are pointed out. In the bottom row above the autoradiograph, presence or absence of LysMSs in the reaction mixture is indicated as + or −, respectively. Used protein concentration is 250 nM. In the top row above the autoradiograph, the three-letter code of the added amino acid is displayed (final concentration 5 mM). (B) EMSAs in which a concentration gradient of a selection of amino acids was tested. Notations are similar as in subpanel A; amino acid concentrations are given in mM. (C) EMSAs to test the effect of the following molecules: d-lys = d-lysine; l-lys = l-lysine; l-gln = l-glutamine; 2-OG = 2-oxoglutarate; DAP = D,l-α,ε-diaminopimelic acid; l-arg = l-arginine; l-can = l-canavanine; l-homoarg = l-homoarginine; l-cit = l-citrulline; l-orn = l-ornithine. Notations are similar as in subpanel (A and B). All cofactor concentrations are displayed in mM. For binding reactions to which l-glutamine and two-oxoglutarate are added simultaneously (indicated by ‘l-gln + 2-OG’), shown concentrations correspond to l-glutamine, whereas 2-oxoglutarate had a final concentration of 5.0 mM in both binding reactions. (D) EMSAs to test low concentration gradients for a selection of cofactors. Notations are similar as in subpanel (A, B and C). However, in this subpanel, cofactor concentrations are displayed in μM. (E) Molecular structures of LysM effector molecules (except for branched-chain amino acids) tentatively ranked according to the strength of their inhibitory effect. The shaded atom in the l-lysine and d-lysine structure indicates a stereochemical difference at this position.

