Figure 3.
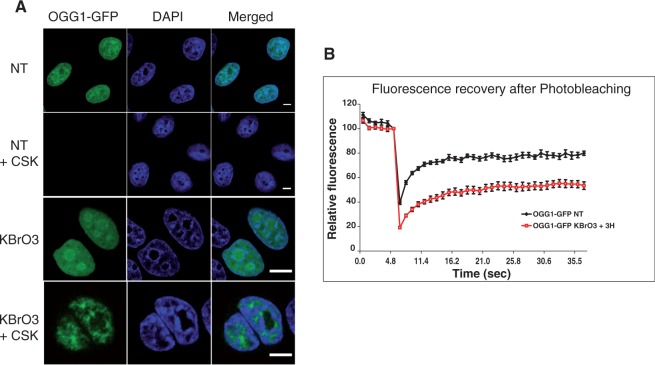
Immobilization of OGG1 after KBrO3 treatment. (A) Distribution patterns of OGG1-GFP in untreated cells (NT) and cells treated with 40 mM of KBrO3 for 30 min. After the treatment, cells were allowed to recover in DMEM at 37°C for 3 h. When indicated, soluble proteins were removed by washing with CSK buffer prior to fixation as described in ‘Materials and Methods’ section. Scale bar, 5 µm. (B) Mobility of OGG1-GFP in NT cells and in cells incubated for 3 h in DMEM after treatment with KBrO3. The mobility of the protein was determined by bleaching a region of the nucleus and measuring the subsequent recovery of fluorescence. Experiments were repeated at least three times and the average of 10 cells from a representative experiment were used to generate graphs. Error bars represent the SEM.

