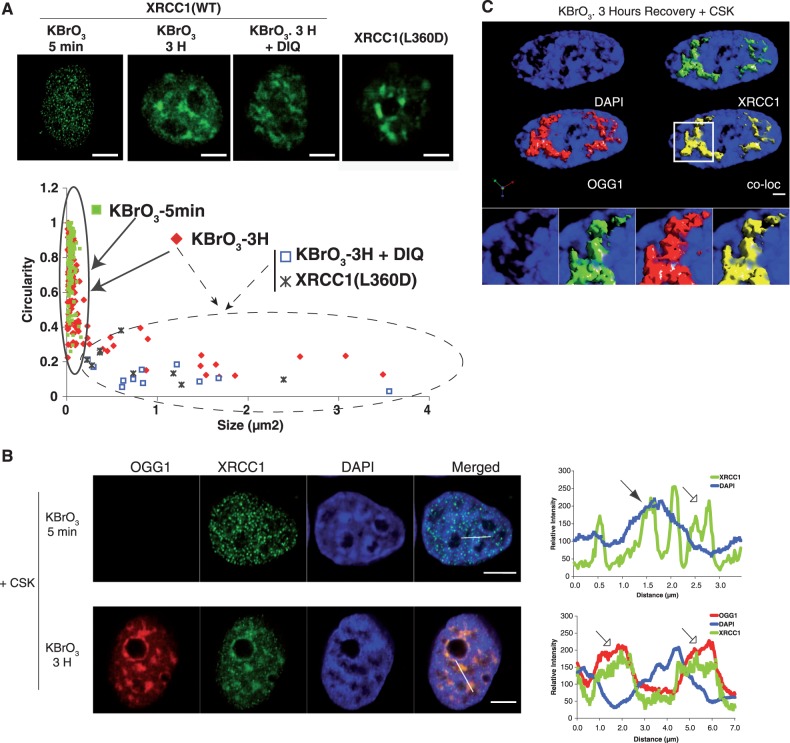
Figure 6.
Visualization of nuclear sub-domains involved in SSBR and BER. (A) HeLa cells expressing XRCC1-GFP or the mutant XRCC1(L360D) were treated with KBrO3 for 30 min and allowed to recover in DMEM for 5 min or 3 h in the presence or absence of the PARP1 inhibitor DIQ. Cells were extracted with CSK buffer prior to fixation. Scatter plots based on size and circularity of the XRCC1-GFP signal are shown. Two patterns can be distinguished: small foci with high circularity (continuous line), and bigger patches with very low circularity (dashed line). (B) Plot profile of fluorescence intensities of DAPI, XRCC1-GFP and OGG1-DsRED, 5 min (upper panel) or 3 h (lower panel) after KBrO3 treatment and CSK pre-extraction were generated through the indicated lines in the image. Weak (hollow arrow) and intense (filled arrow) DAPI stained regions are indicated. (C) Three-dimensional image reconstruction with isosurface rendering for OGG1 and XRCC1, showing enrichment of the proteins in less condensed DAPI regions of the nucleus. The co-localization panel (co-loc) shows in yellow only pixels in which both red and green signals are detected. Pearson’s correlation coefficient between OGG1 and XRCC1 was of 0.95. Scale bar, 5 µm.

