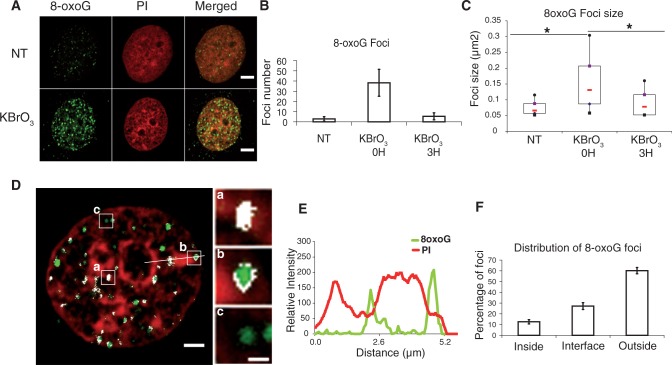
Figure 7.
Distribution of 8-oxoG induced by KBrO3 treatment. (A) HeLa cells overexpressing the glycosylase OGG1-GFP, treated with KBrO3 or not (NT) were immunostained with anti-8oxoG antibody. Scale bar, 5 µm. (B) Foci number and (C) size in at least 50 cells were quantified using ImageJ. *P < 0.05 using Kruskal and Wallis test. (D) Distribution of 8-oxoG foci with respect to heterochromatin domains labelled with propidium iodide (scale bar, 2 µm), representative foci located inside (a), at the interface (b) or outside (c) of the heterochromatin domains are shown (scale bar, 0.5 µm). Pixels in which green and red signals co-localize are depicted in white. (E) Plot profile of 8-oxoG (green) and PI (red) signals along the line shown in (D), showing the localization of 8-oxoG foci at the periphery of heterochromatin domains. (F) 8-oxoG foci located inside, at the interface and outside heterochromatin domains, were counted in 3D images using the ImageJ software (10 cells were used for the analysis).

