Figure 7.
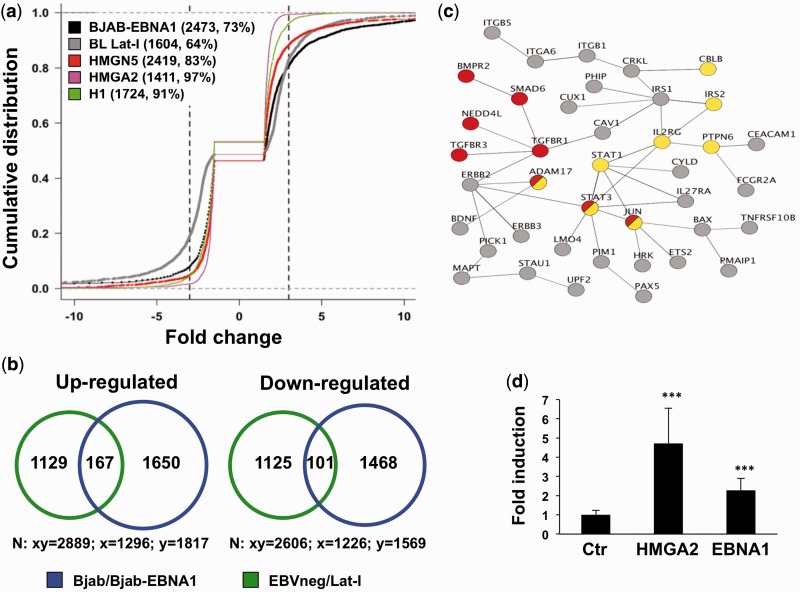
The transcriptional effect of EBNA1 is similar to that of HMGA proteins. (a) Empirical cumulative distribution function plots illustrating the distribution of genes differentially expressed in BJAB/BJAB-EBNA1 (black), BL EBVneg/Lat-I pairs (gray), HMGN5 (pink) or HMGA2 (red) transfected cells and histone H1 knockdown cells (green). The number of differentially regulated genes falling in the −3- to +3-fold interval (dotted lines) and the % relative to the total number of regulated genes are indicated. (b) Venn diagram depicting the overlap of genes whose expression is regulated in BJAB-EBNA1 and Lat-I cells compared with EBV negative BLs. A total of 268 genes, 167 upregulated and 101 downregulated, were commonly affected. (c) Protein–protein interaction networks of 66 genes concordantly regulated that are predicted by the STRING database to have one or more interacting partner with the highest confidence score (>0.9). The Panther and KEGG databases were used to identify signaling pathways in the network. Several components of the TGFβ (red circles) and JAK/STAT (yellow circles) signaling pathways were concordantly regulated. (d) Luciferase reporter assay of Twist promoter activity in HepG2 cells. The bars represent the mean ± SD of normalized luciferase activity from four independent experiments, each performed in triplicate.

