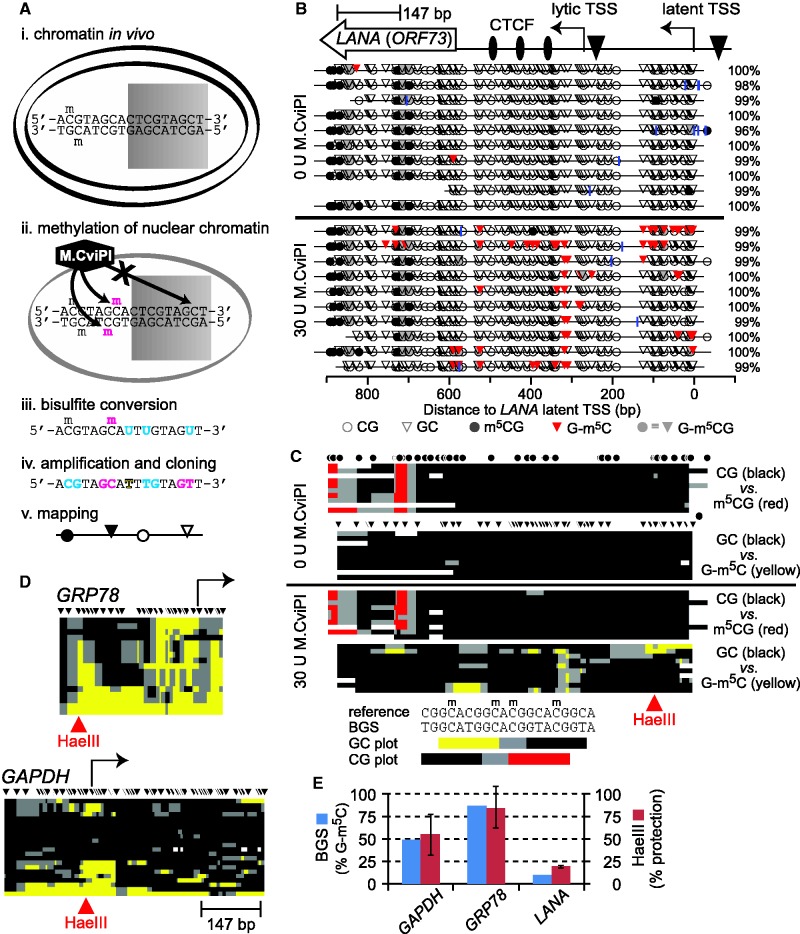
Figure 1.
MAPit analysis of chromatin structural diversity. (A) MAPit workflow diagram, adapted from Darst et al. (13). Chromatin (e.g. nucleosomes) modulates accessibility of DNA sites to soluble proteins, such as (i) transcription factors (represented by shaded rectangle) in live cells, or (ii) exogenous M.CviPI DNMT in nuclei. Bisulfite treatment (iii) records M.CviPI accessibility pattern in the DNA sequence by conversion of unmethylated cytosine to uracil (cyan). Subsequent amplification and cloning (iv) allows recovery of this information from individual molecules. Note that endogenous and probe methylation sites are distinguished by sequence specificity of the respective DNMTs (respectively, cyan and magenta). The DNA sequences obtained are used to generate maps (v) of DNA methylation and accessibility. (B) MAPit at the KSHV gene LANA detected endogenous methylation and sporadic accessibility of the latent promoter. MAPit was performed in nuclei of BCBL1 cells. Top: map of genetic elements within the MAPit amplicon: LANA ORF (ORF73), three CTCF sites (ovals), lytic and latent TSSs (bent arrows) and TATA boxes (triangles). Middle: MethylViewer (22) display of MAPit results from control nuclei probed as indicated with 0 U or 30 U M.CviPI. Blue vertical ticks indicate positions of unconverted cytosines, excluding GC and CG sites (i.e. HCH); percent conversion of all HCH cytosines for each sequence clone is given on the right. Bottom (key): Circles and triangles, respectively, indicate CG and GC sites. Methylated sites are shaded. Methylated GCG sites are shaded gray to indicate their ambiguity; however, comparison of sequences from nuclei with and without M.CviPI treatment (middle, lower and upper panels) indicated that GCG sites within the LANA ORF were endogenously methylated. (C) Condensed view of the data in B, to scale with locus map at top. Each row of pixels represents one cloned sequence, i.e. molecule. Each plot tracks only GC or CG methylation; GCG sites are ignored. As indicated by key at bottom, spans of color mark ≥2 contiguous methylated sites; black marks ≥2 contiguous unmethylated sites; gray marks spans between methylated and unmethylated sites; white indicates missing or unaligned sequence. Positions of sites are indicated by circles and triangles (HCG and GCH, respectively). (D) Host promoters varied in degree of accessibility to M.CviPI. Maps of GC methylation at two representative promoters are shown, to scale with LANA amplicon. (E) MAPit at the three loci shown was semi-quantitative. At the HaeIII sites indicated in red at GAPDH, GRP78 and LANA, 10 of 20, 15 of 17 and 1 of 10 molecules had a methylated GC site, respectively (blue bars). R.HaeIII digestion followed by quantitative real-time PCR was used to measure bulk methylation of the same three sites in genomic DNA purified from M.CviPI-treated nuclei (red bars). Under these conditions, ∼95% of DNA from untreated nuclei (i.e. unmethylated) was digested (not shown). The concordance between BGS and R.HaeIII digest indicated that representation of methylated and unmethylated molecules in MAPit was unbiased.

