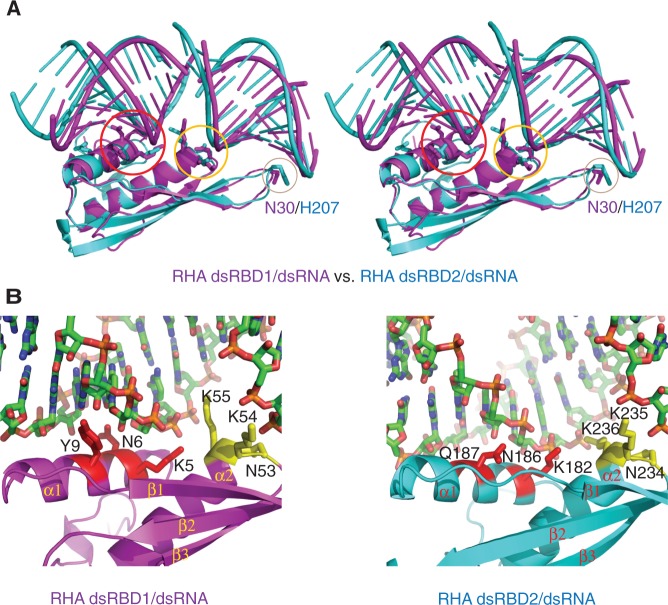
Figure 2.
Structural comparison of RHA dsRBDs in complex with dsRNAs. (A) Stereoview of structural superimposition of RHA dsRBD1/GC10 duplex (magenta) with RHA dsRBD2/GC10 duplex (cyan). The three protein–RNA interaction regions are highlighted in the circles coloured in red, yellow and wheat, respectively. The key residues (N30 in dsRBD1 and H207 in dsRBD2) involved in dsRNA binding in region 2 are shown in stick mode. (B) Close-view of the molecular details of dsRNA recognition by RHA dsRBDs. (Left panel) Structural details of dsRNA recognition by RHA dsRBD1. Residues involved in dsRNA recognition in region 1 and 3 are coloured in red and yellow, respectively. (Right panel) Structural details of dsRNA recognition by RHA dsRBD2. Residues involved in dsRNA recognition in region 1 and 3 are coloured in red and yellow, respectively.

