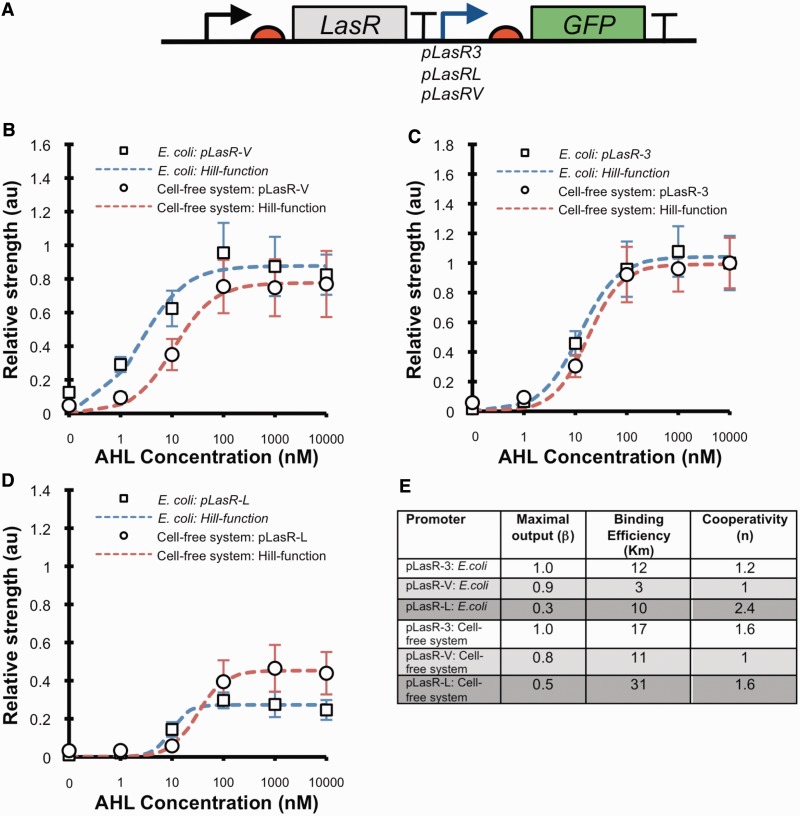
Figure 3.
Characterization of inducible promoters in cell-free systems and E. coli. (A) Diagram of the LasR responsive promoter test constructs. The relative promoter strength of the inducible promoters in response to a range of AHL concentrations were calculated from measurements in E. coli and cell-free systems for the LasR responsive promoters (B) pLasRV, (C) pLasR3 and (D) pLasRL. For experiments in E. coli, fluorescence and absorbance at 600 nm were measured in the mid-log phase of growth to calculate the relative promoter strength. Each promoter was normalized to the strength of pLasR3 at 10 µM AHL. The data represent the mean ± the SD of three independent cultivations. For experiments in cell-free systems, 1 µg of plasmid DNA was added to each reaction and fluorescence measured. The relative promoter strength was calculated from the rate of fluorescence increase in the maximal phase of GFP expression, 30–45 min after initiation, and normalized to the strength of pLasR3 at 10 µM AHL. The data represent the mean ± the SD of three independent reactions. (E) Summary of the fitted Hill function equation parameters for the three LasR responsive promoters calculated from in vivo and cell-free systems characterization data.

