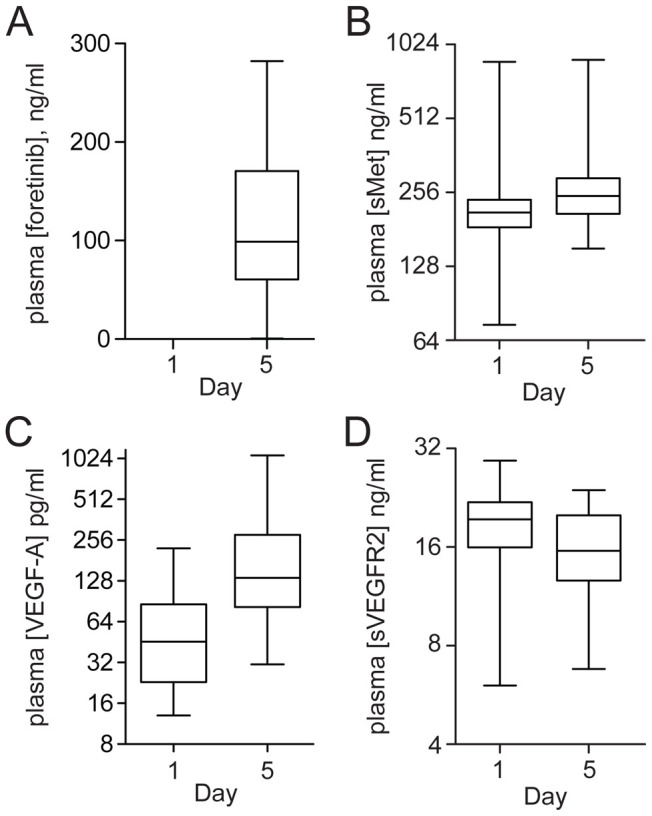
Figure 3. Plasma concentrations of foretinib (A), sMET (B), VEGF-A (C) and sVEGFR2 (D) at days 1 and 5, which encompass the first dosing interval of the intermittent 5/9 dosing group.

Box and whisker plots show median ±25% within the box and 100% range of all values within whiskers. Median values for plasma foretinib and each marker shown change significantly over this interval (P<0.0001). Other significant marker changes are discussed in the text.
