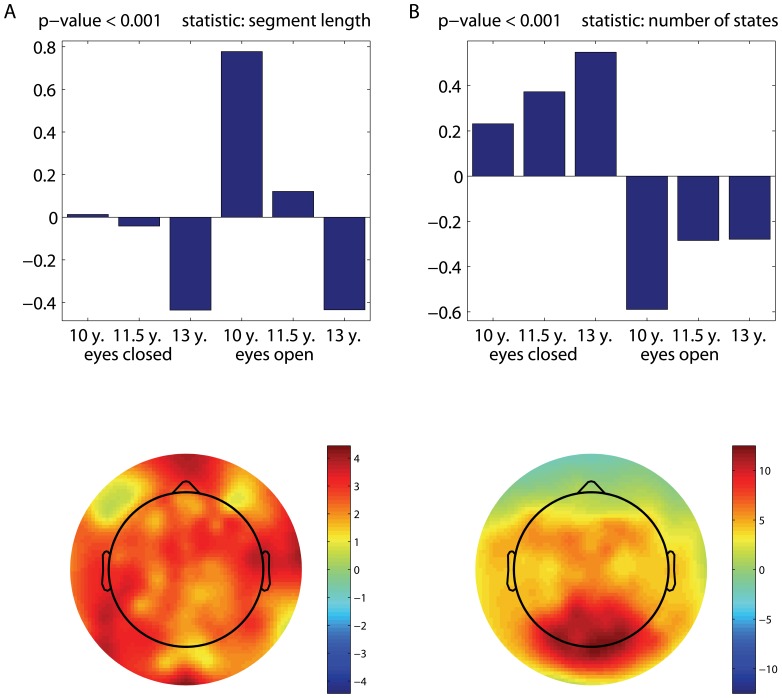
Figure 2. Data-driven contrast between groups and conditions.
Age-dependent and condition-specific changes in non-stationarity in terms of: (a) the duration of quasi-stationary states, and (b) the number of states. The patterns of changes represented by the data-driven contrasts from the corresponding mean-centered PLS analyses are shown in the upper parts. The topographic maps (PLS bootstrap ratio values) reflect the spatial distribution of electrode loadings, showing the electrodes' contribution to the identified contrast.

