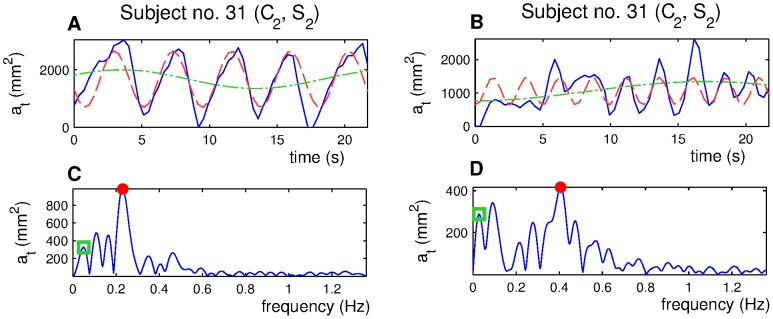
Figure 3. Dif-curves (A, B, solid line) and appropriate spectra (C, D, solid line).

Extracted res-curves (red dashed line, A, B) and pos-curves (green dotted line, A, B) with corresponding spectral peaks (C, D) marked in the spectra with a red dot (respiratory peak) and a green square (postural peak).
