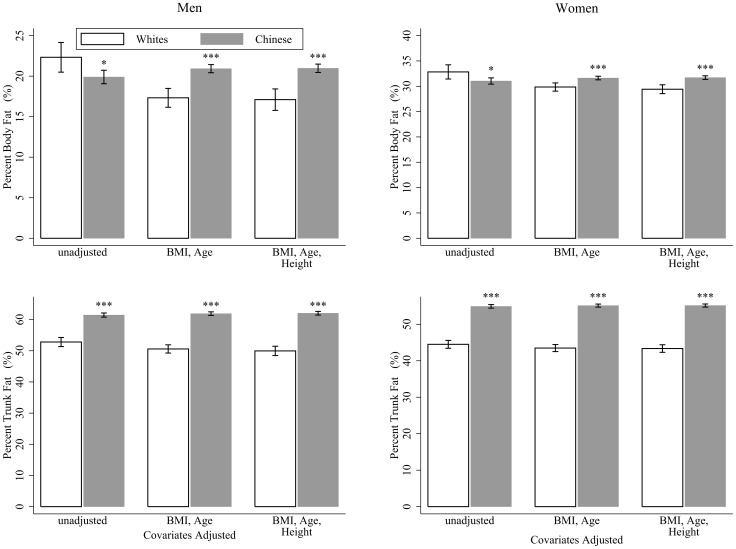
Figure 2. Percentage body fat and percentage trunk fat by ethnicity in men and women.
Error bars represent 95% confidence intervals. Data were analyzed by using analysis of covariance (ANCOVA) with “ethnicity” as the grouping variable and the listed variables as covariates. BMI, body mass index. *p<0.05, **p<0.01, ***p<0.001, for the difference with white men or women, respectively.

