Figure 4.
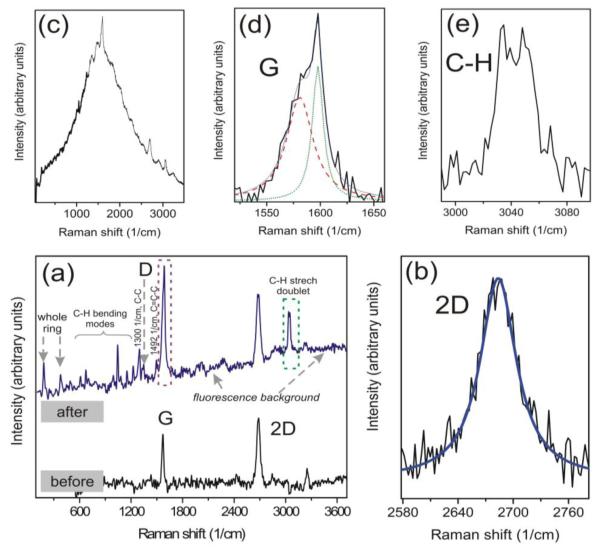
(Color online) Raman spectra of graphene and benzyne-graphene. (a) The spectra of a CVD-grown graphene sample taken from the same point before and after the 8 days-long functionalization treatment (the reaction of graphene with o-trimethylsilylphenyl triflate and CsF), with numerically extracted background from Cu substrate. For the discussion of new lines appearing in the spectrum after treatment see the text. (b): The shape of 2D line in our graphene sample before treatment: single Lorentzian at 2680 cm−1. (c):The raw spectrum of 8 days-treated graphene layer on Cu. (d):The part of the Raman spectrum of treated sample showing the result of benzyne attachment in the G-band region (encircled by the maroon dashed frame in (a)). The G-line of graphene (red dashed line, peak at ~1582 cm−1) overlaps with the C=C-C vibration of the attached benzyne ring (olive dotted line, peak at ~1595 cm−1). (e): The C-H stretching doublet near 3060 cm−1 appeared in the spectrum of treated sample (encircled by olive dashed frame in (a)). Excitation wavelength λexc=532 nm.

