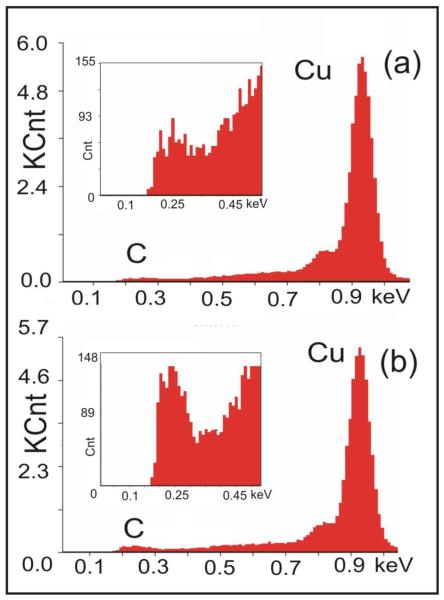
Figure 6.
(a):The low energy part of EDX spectrum (X-ray intensity in counts or kilocounts (Cnt, KCnt) vs. photon energy) of the as-grown CVD graphene layer on Cu substrate around C K and Cu L X-ray emission lines [32], the inset represents the details of this spectrum near C K-line. Here the peak intensity of C K-line ICK~80 counts, the ratio of peak intensities of C K and Cu L lines ICK/ICuL~0.014. (b)-the EDX spectrum of the part of the same sample after 8 days of reaction in the mixture of o-trimethylsilylphenyl triflate with cesium fluoride; ICK~140 counts, ICK/ICuL~0.028. Both parts of the sample (the as-grown part, and the part after the reaction) were placed to the sample holder and measured in one experiment under the same electron beam focusing conditions; the same size/shape area of 4000 μm2 has been used for signal collection.

