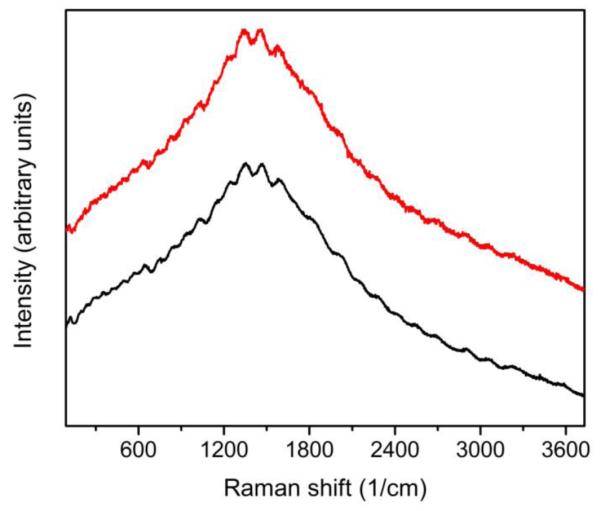
Figure 7.

(Color online). The Raman spectrum from non-oxidized area of a clean etched and annealed surface of Cu substrate before (bottom, black curve) and after (top, red curve) 8 days of treatment in the mixture of TMST with CsF. No new lines or extra features in Raman spectra after the treatment. Excitation wavelength λexc=532 nm.
