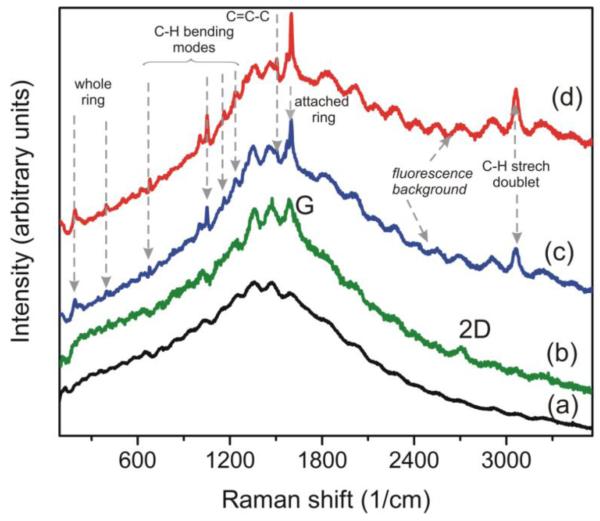
Figure 8.
(Color online) Raman spectra of pure cleaned annealed Cu substrate (a) and raw Raman spectra (without numerical removal of Cu background) of the CVD-grown few-layer graphene: (b) as-grown, (c) after 2 days of functionalization in the mixture of TMST with CsF, (d) after 6 days of functionalization. Increase of the duration of treatment leads to the increase of intensities of C-H and C=C-C lines, and to the increase of fluorescence signal, what indicates on the higher concentrations of attached benzyne rings after longer treatment durations. Excitation wavelength for Raman measurements λexc=532 nm.

