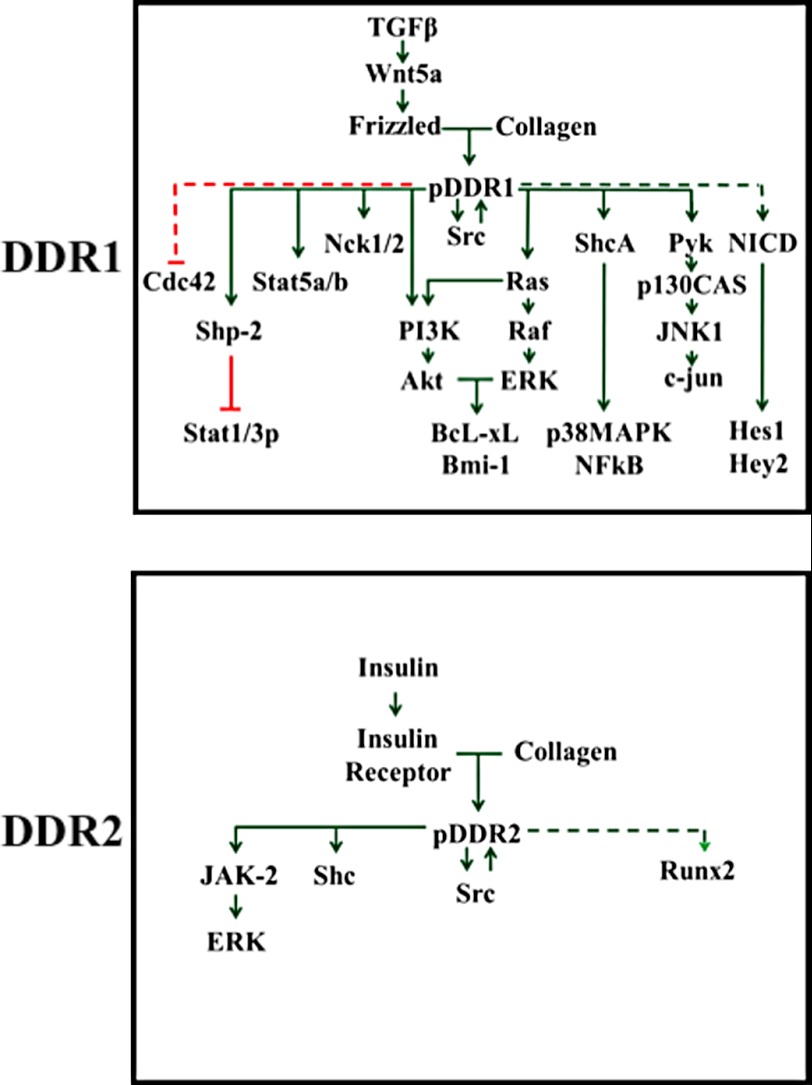
FIGURE 3.
DDR signaling. The wiring diagram depicts signaling effectors of DDR activated in response to collagen. Solid and dashed green arrows indicate direct and indirect positive signaling effectors upstream and downstream of phosphorylated DDRs (pDDR), respectively. Red lines indicate direct (solid) and indirect (dashed) negative effects of phosphorylated DDRs on signaling effectors.

