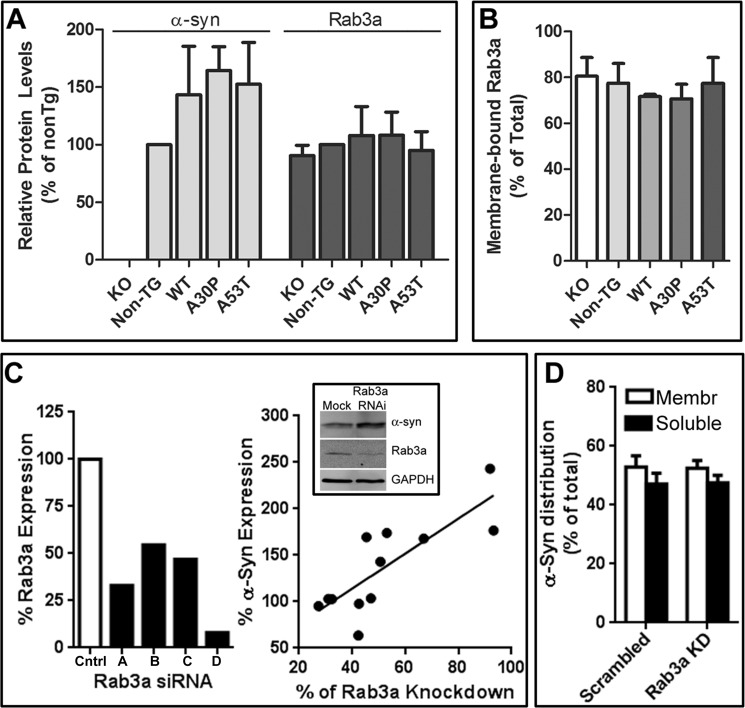
FIGURE 9.
Reciprocal consequences of modifying α-syn and Rab3a expression levels. Synaptosomes from α-syn-deficient (KO), nontransgenic (Non-TG), overexpressing human wild-type or mutant α-syn (WT, A30P, and A53T) mice analyzed for total α-syn and Rab3a (A), and membrane-associated Rab3a (B). C, left panel shows relative Rab3a expression in SH-SY5Y cells that were either transfected with nontargeting siRNA (Cntrl) or four siRNA against Rab3a (KD). The right panel compares the Rab3a knockdown in individual experiments to α-syn expression. Total lysates from cells transfected with all four siRNAs were run on Western blots and probed for Rab3a, α-synuclein, and GAPDH (inset). Quantified α-syn expression levels in cells transfected with siRNA against Rab3a, relative to the levels in the nontargeting siRNA-transfected cells, were plotted against the level of Rab3a knockdown (all normalized to GAPDH signal). An inverse correlation between α-synuclein and Rab3a protein levels at rest can be seen using a least squares linear regression model (r2 = 0.5609). D, distribution of α-syn in membrane (Membr) and cytosolic (Soluble) fractions following 10 min of stimulation with 55 mm potassium of SH-SY5Y cells transfected with control (Scrambled) or four Rab3a siRNA. Bars represent mean ± S.E. from four independent experiments.

