FIGURE 5.
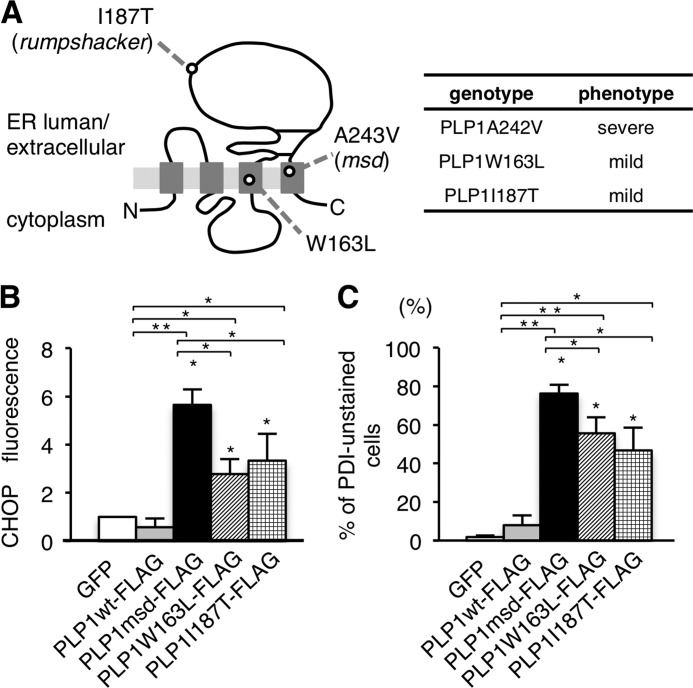
Effect of different PLP1 mutations on ER chaperones. A, schematic diagram of PLP1 with the positions of mutations examined in this study (left) and their associated phenotypes (right). B, expression of CHOP in HeLa cells transfected with the PLP1wt and mutant PLP1 genes. The fluorescence intensity of CHOP in the nuclei was analyzed by densitometry as described in the legend to Fig. 4B. C, proportion of unstained cells with anti-PDI antibody in HeLa cells transfected with PLP1wt and the indicated PLP1 mutant genes as described in the legend to Fig. 4C. Bar graphs are represented as fold-induction ± S.E. against the mean of control experiment from three independent experiments with >100 cells counted in each experiment (*, p ≤ 0.05; **, p ≤ 0.005).

