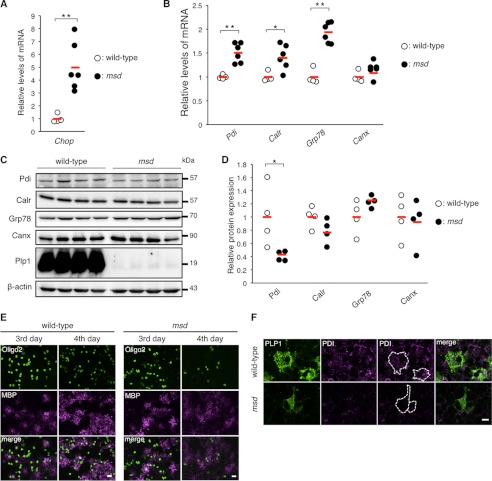
FIGURE 6.
PDI is down-regulated in the SCs and primary oligodendrocytes of msd mice. A and B, quantitative analysis of Chop (A), Pdi, Calr, Grp78, and Canx genes (B) in the SCs of msd mice. Quantitative RT-PCR was performed to analyze the expression levels of Pdi, Calr, Grp78, and Canx in the SCs of wild-type (open circle, n = 4) and msd (filled circle, n = 6) mice at P14. GAPDH was used as an internal control. The results are represented as fold-induction against the means of wild-type mice. Red horizontal bars indicate the mean. C and D, relative amounts of ER chaperones in the SCs of msd mice. The SCs of P14 wild-type (open circle, n = 4) and msd (filled circle, n = 4) mice were subjected to immunoblotting with the indicated antibodies (C). The amounts of the proteins were measured by densitometry and normalized to β-actin (D). E, expression of MBP and Olig2 in primary oligodendrocytes from msd mice. Immunocytochemistry of MBP and Oligo2 in primary oligodendrocytes of msd mice. Primary mixed glial cultures were prepared from the forebrains of E14.5 wild-type or msd mice. On the 3rd and 4th days after induction of oligodendrocyte differentiation, the oligodendrocytes were immunostained with anti-MBP (magenta) and anti-Oligo2 (green) antibodies and observed with a confocal fluorescence microscope. Scale bar, 5 μm. F, immunocytochemistry of PDI in primary oligodendrocytes of msd mice. Primary oligodendrocytes prepared from the forebrains of wild-type or msd mice at E14.5 and immunostained with anti-PLP1 (green) and anti-PDI (magenta) antibodies and observed with a confocal microscope. Scale bar, 5 μm. A, B, and D, *, p ≤ 0.05; **, p ≤ 0.005.

