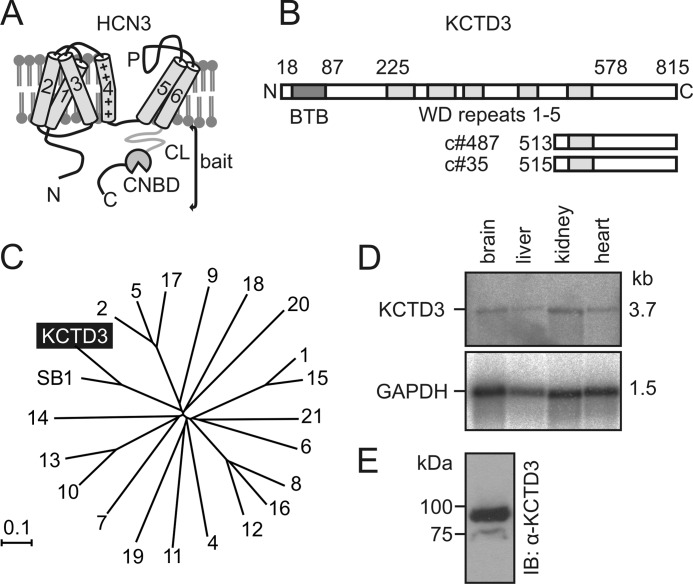
FIGURE 1.
Identification of KCTD3 as HCN3-interacting protein in mouse brain. A, domain structure of HCN3. 1–6, transmembrane helices 1–6 including positively charged (”+”) fourth helix; P, pore loop; CL, C-linker, CNBD, cyclic nucleotide-binding domain. The complete cytosolic C terminus was used as bait in a yeast two-hybrid (Y2H) screen. B, schematic representation of the KCTD3 protein. Numbers on top of the scheme mark the borders of the BTB domain (BTB, red), and the five WD (green) repeats. The two partial KCTD3 clones (c#487 and c#35) identified in the 2YH screen are shown below the full-length KCTD3. C, phylogenetic tree of the KCTD superfamily comprising 22 members in the mouse genome. The proteins are designated with numbers (e.g. “4” means KCTD4) or, in case of KCTD3 and its closest relative SB1, with the complete names. The tree was created using NJ BLOT. The branch distance was determined by observed divergency. The scale bar indicates the degree of genetic divergence in arbitrary units. D, Northern blot analysis of KCTD3 revealing mRNA expression in mouse tissues. The size of the KCTD3 transcript (3.7 kb) is indicated. Lower panel, as loading control the blot was reprobed for GAPDH mRNA expression. E, Western blot analysis of KCTD3 in mouse brain lysate using rabbit polyclonal anti-KCTD3 antibody.

