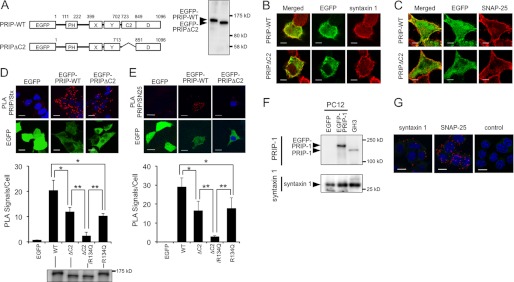
FIGURE 6.

Co-localization of PRIP with t-SNARE proteins in intact cells. A, proper expression with the expected molecular mass of each construct in PC12 cells was confirmed by Western blotting with anti-GFP antibody. B and C, PC12 cells expressing EGFP-PRIP-WT or EGFP-PRIPΔC2 were cultured on coverslips and visualized in green for EGFP and red for intrinsic syntaxin 1 (B) or SNAP-25 (C) by indirect immunofluorescence using a combination of rabbit antibody against GFP and Alexa 488-conjugated rabbit IgG and mouse antibodies against syntaxin 1 or SNAP-25 and Cy3-conjugated mouse IgG, respectively. The yellowish staining in the merged picture indicates co-localization of EGFP-PRIP-WT or EGFP-PRIPΔC2 with the SNARE proteins. Scale bars, 5 μm. D and E, PC12 cells expressing EGFP-fused PRIP-WT or the mutant constructs indicated in the graphs were cultured on coverslips and subjected to PLA assay using the combination of the antibodies against PRIP-1 and syntaxin 1 (Stx) or SNAP-25 (SN25) and visualized in red for PLA signals, green for EGFP signals, and blue for counter stained nucleus. Scale bars, 10 μm. Typical images for EGFP, WT, and ΔC2 constructs of PRIP expressing cells are shown. In each image, the number of PLA signals/cell was counted using Duolink Image Tool with manual corrections and presented as bar graphs. More than 30 cells for each experiment were counted, and the data are the means ± S.D. of three experiments. Significance by Student's t tests is represented by * or ** for p < 0.05 or p < 0.01, respectively. Comparable expression of each construct in PC12 cells was confirmed by Western blotting with anti-GFP antibody in D. F, endogenous expression of PRIP-1 in GH3 cells but not in PC12 cells were confirmed. The same numbers of GH3 cells and PC12 cells expressing EGFP alone or EGFP-PRIP-WT were subjected to SDS-PAGE, followed by Western blotting by anti-PRIP-1 antibody. The presence of endogenous syntaxin 1 in GH3 and PC12 cells was also analyzed with anti-syntaxin 1 antibody. G, GH3 cells were cultured on coverslips and subjected to PLA assay using the combination of the antibodies against PRIP-1 and syntaxin 1, SNAP-25, or mouse control IgG and visualized in red for PLA signals and blue for counter stained nucleus. Scale bars, 10 μm. Typical images among more than four observations were shown. Green are background signals that were visualized by hyper enhancement of the green channel to help cell shape recognition.
