FIGURE 1.
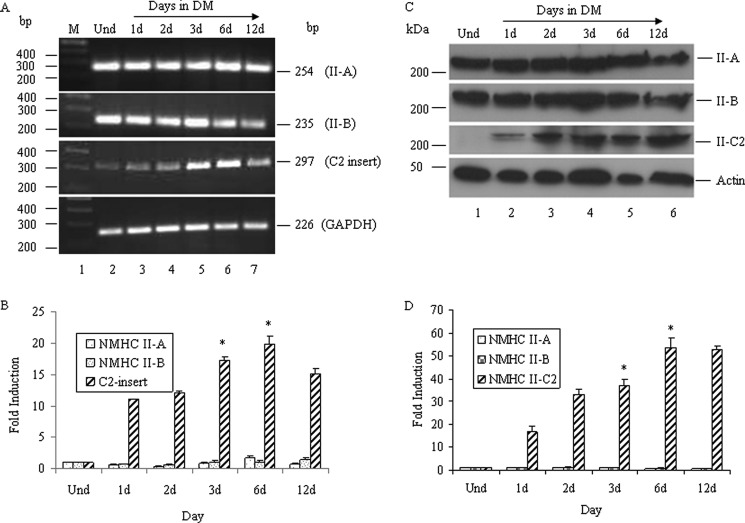
Expression of NMHC II-C2 is induced during differentiation. Total RNA from undifferentiated and differentiated Neuro-2a cells at the indicated time was subjected to RT-PCR analysis for NMHC II isoforms using primers specific for each isoform. A, expression of the NMHC IIs, as indicated. GAPDH was used as a control for cDNA in the PCR. B, quantification of NMHC II-A, NMHC II-B, and C2 insert-containing NMHC II-C mRNA, which was done by quantitative real-time PCR, and -fold induction during differentiation compared with undifferentiated cells (Und) was calculated using the equation, -fold induction = 2−ΔΔCt, where Ct represents the threshold cycle number for a gene. C, cell lysates from differentiated Neuro-2a cells at the indicated times were subjected to immunoblot using anti-C2 insert, NMHC II-A, NMHC II-B, and actin antibodies. Note that the expression of the C2 insert-containing isoform increased with the differentiation, whereas that of II-A and II-B remained unchanged. Actin was used as a loading control. Results show representative blots from a total of three experiments. Quantification of C2 insert-containing NMHC II-Cs and NMHC II-A/II-B expression is shown in D, considering band intensity of the immunoblot in undifferentiated cells as 1. Results are expressed as mean ± S.E. (error bars) from three independent experiments. *, p < 0.05 for undifferentiated versus 3/6-day differentiated cells. d, days.

