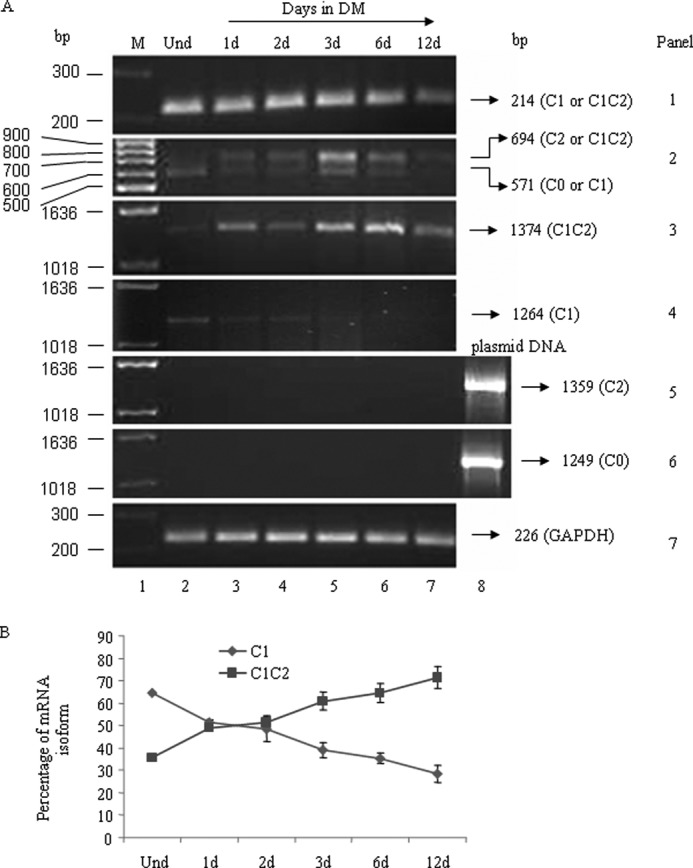
FIGURE 2.

Quantification of NMHC II-C mRNA isoforms. Total RNA from undifferentiated (lane 2) and differentiated Neuro-2a cells at the indicated time (after the addition of DM, lanes 3–7) was subjected to RT-PCR analysis for NMHC II-C isoforms using primers specific for each NMHC II-C isoform. The panels in A show the expression of each isoform of NMHC II-C, as indicated in a representative gel. GAPDH was used as a control for cDNA in the PCR. Plasmid DNA encoding NMHC II-C0 or NMHC II-C2 (lane 8) was used as positive control for PCR in panels 5 and 6. Note that C1 and C1C2 mRNA are the major isoforms expressed in 3–6-day-differentiated Neuro-2a cells. B, quantification of C1 and C1C2 mRNA was expressed as a percentage of total NMHC II-C mRNA (see panel 2 in A). Percentage of an isoform = (intensity of band corresponding to an isoform/total intensity of two bands generated using C2 flanking primers) × 100. Band intensity was measured using ImageJ software. Note that the NMHC II-C1C2 population was increased with differentiation, whereas that of NMHC II-C1 decreased. Results are expressed as mean ± S.E. (error bars) from three independent experiments. d, days.
