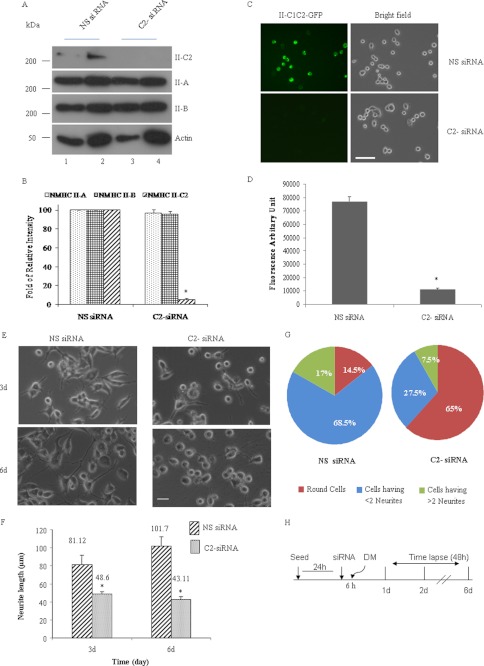
FIGURE 3.
Inhibition of NM II-C1C2 isoform expression interferes with neuritogenesis. A, immunoblots of two different amounts of Neuro-2a cell lysates with the indicated antibodies. Note that C2-siRNA specifically inhibited NMHC II-C1C2 expression but not NMHC II-A or NMHC II-B expression. Cell lysates were prepared at 72 h after siRNA transfection. B, -fold inhibition by siRNA treatment was calculated by measuring band intensity using ImageJ software and considering the band intensity of NMHC II-C1C2 in nonspecific siRNA-treated cells as 1. C, microscopy images of Neuro-2a cells transfected with GFP-tagged NMHC II-C1C2 and nonspecific siRNA or C2-siRNA. Top left panel, green fluorescence signal coming from NMHC II-C1C2-GFP in nonspecific siRNA-treated cells; bottom left panel, inhibition of fluorescence intensity in C2-siRNA-treated cells. Their corresponding bright field images are shown in the right panels. -Fold inhibition in fluorescence intensity was calculated using NIS-D software and is shown in D. E, bright field images of nonspecific siRNA-treated (left panels) and C2-siRNA-treated (right panels) Neuro-2a cells. Top and bottom panels, 3 and 6 days postdifferentiation, respectively. Neurite length was measured using ImageJ software. Quantification is shown in F. G, pie chart shows that more than 65% cells are round after C2-siRNA treatment. H, schematic representation of time schedule for the addition of siRNA and DM and time lapse microscopy. Scale bar, 100 μm. Results are expressed as mean ± S.E. (error bars) from three independent experiments. *, p < 0.05, nonspecific versus C2-siRNA. d, days.

