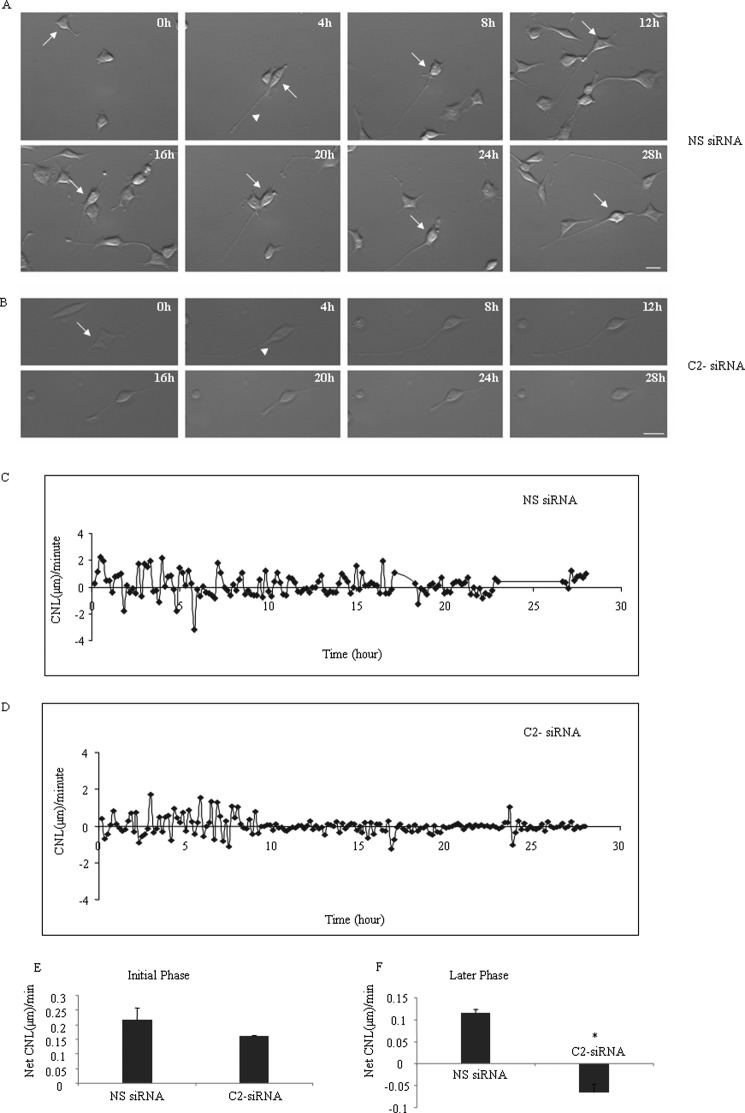
FIGURE 5.
NM II-C1C2-depleted cells show shortening of neurite length. Time lapse images of Neuro-2a cells during differentiation, which were previously treated with nonspecific (A) or C2-siRNA (B). Note that the C2-siRNA-treated cell shows an increase in neurite length, but after 8–10 h of neuritogenesis, the neurite starts having frequent periods of shortening and shows no growth until 28 h of neuritogenesis, whereas control cells treated with nonspecific siRNA show no shortening of neurite length. The arrows indicate the cells that were tracked, and the arrowheads show neurites for which changes of length were measured. C and D, change in neurite length/min over the 28-h period of neuritogenesis of nonspecific siRNA- and C2-siRNA-treated cells. Note that the amplitude value in control neurites is reduced with time, and neurites of C2-siRNA-treated cells show a net average negative value of CNL/min between 8 and 28 h of neuritogenesis. E and F, quantification of net average CNL/min value in nonspecific siRNA- and C2-siRNA treated neurites during initial and later stage of neuritogenesis. Data are represented as means ± S.E. (error bars). *, p < 0.05, not significant (NS) versus C2-siRNA; n > 10 neurites from each treatment; h, hours; scale bar, 10 μm.

