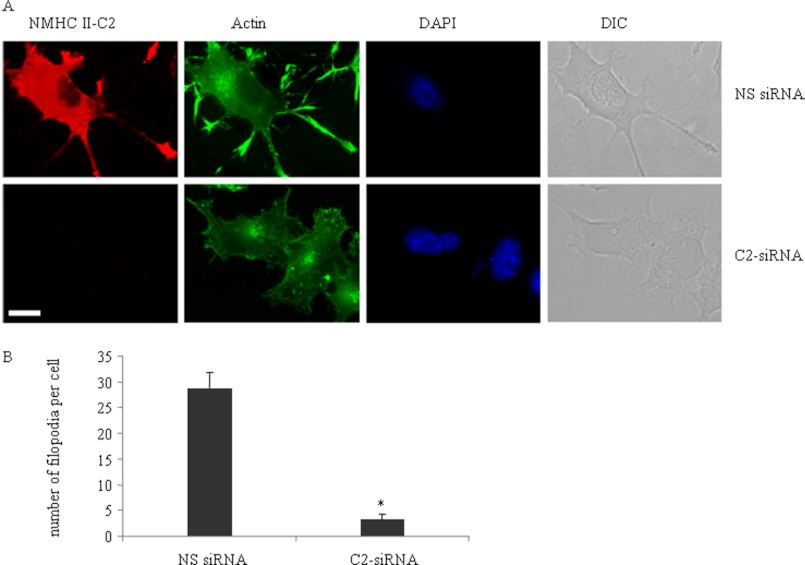
FIGURE 8.
Depletion of NM II-C1C2 reduces filopodia frequency in differentiated Neuro-2a cells. A, phalloidin staining to indicate actin localization (green) in nonspecific siRNA-treated (top row) and C2-siRNA-treated (bottom row) Neuro-2a cells after 3 days of differentiation. DAPI (blue) was used to stain nuclei. Note that C2-siRNA reduces the expression of NM II-C1C2 (red) in C2-siRNA-treated cells. B, filopodia frequency in cells transfected with nonspecific and C2-siRNA. Scale bar, 10 μm. *, statistical significance of nonspecific siRNA-treated versus C2-siRNA-treated cells (p < 0.05, n > 25 cells from each group). Error bars, S.E. DIC, differential interference contrast.

