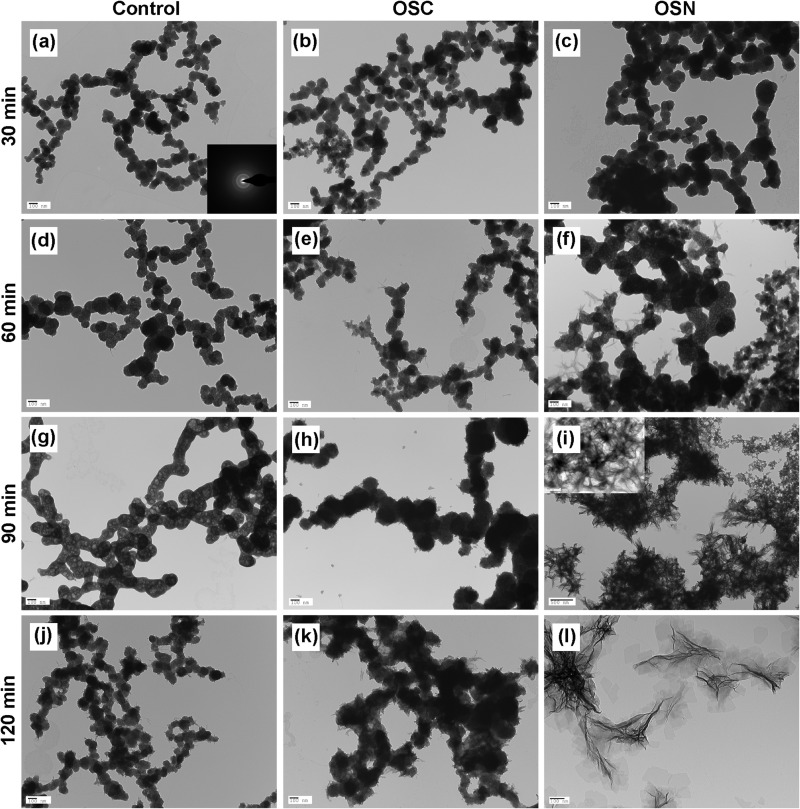
FIGURE 2.
TEM images of calcium phosphate minerals formed in the presence of OSC, OSN, and control. Calcium phosphate minerals formed in the control sample and in the presence of OSC and OSN after 30 (a–c), 60 (d–f), 90 (g–i), and 120 (j–l) min of incubation are presented. 5 μl of each peptide solution was added to a micro test tube followed by the addition of 5 μl of CaCl2 and Na2HPO4 solutions to achieve a final concentration of 1.6 mm Na2HPO4 and 3.3 mm CaCl2 (pH = 7.4). 10 μl of each solution containing OSC and OSN was immediately pipetted onto a carbon-coated Cu TEM grid. For the control experiments, the same concentration of CaCl2 and Na2HPO4 in Tris-HCl buffer in the absence of peptides was used. Amorphous calcium phosphate deposit was observed in the control and OSC samples, whereas crystalline calcium phosphate was formed in the presence of OSN. In a, the inset shows a SAED pattern that represents the ACP structure.

