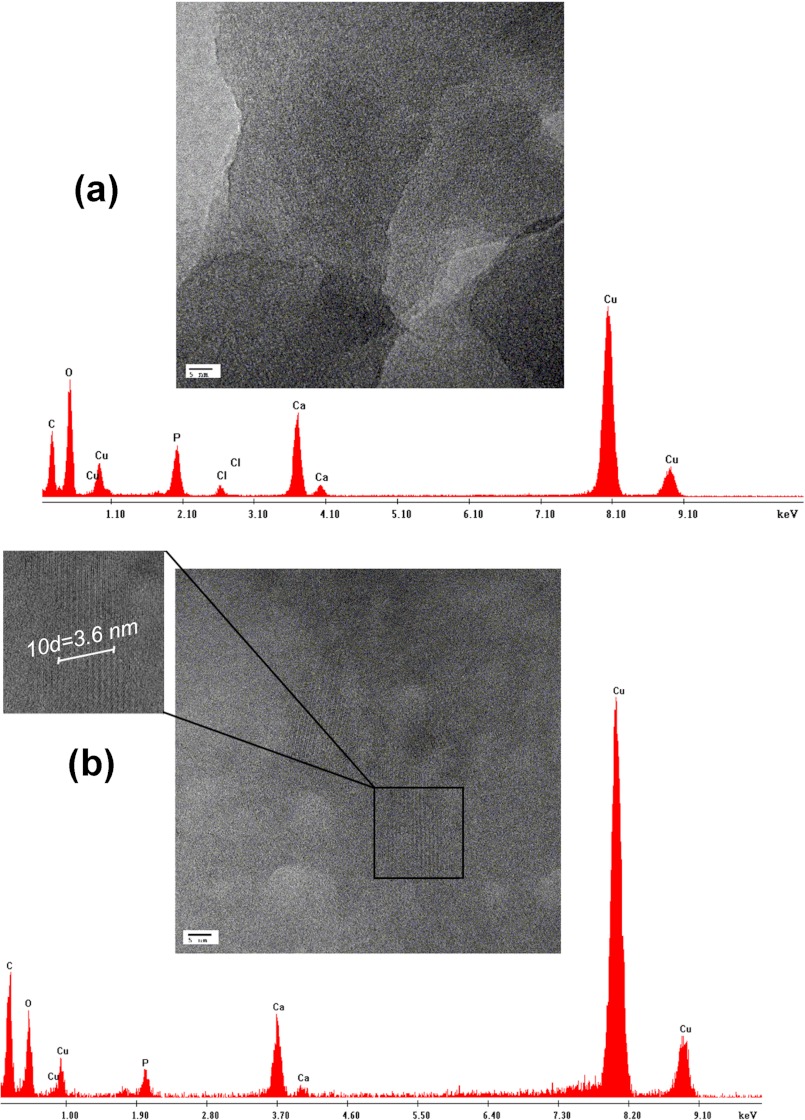
FIGURE 4.
High resolution TEM images and energy-dispersive x-ray analysis spectra of minerals formed in the presence of OSC and OSN. High resolution TEM image of calcium phosphate mineral formed in the presence of OSC (a) and crystal lattice fringe image of OSN (b) are shown. A d-spacing of 0.36 nm was calculated for the OSN, which is in agreement with theoretical data for the (211) crystallographic plane of HA. Energy-dispersive x-ray analysis indicated the Ca/P ratio of 1.27 ± 0.001 for OSC and 1.67 ± 0.003 for OSN, which matches the theoretical Ca/P ratio for HA.

