
FIGURE 2.
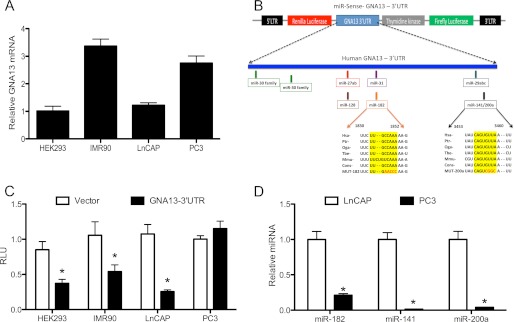
microRNAs -182 and -141/200a regulate GNA13 expression post-transcriptionally. A, GNA13 mRNA expression in 4 different cell lines. The relative GNA13 mRNA, quantified by real-time PCR expression, is shown relative to that in HEK-293 cells. B, schematic representation of GNA13–3′-UTR in the miR-Sens-Luciferase reporter vector, and the predicted miRNA binding sites within the UTR sequence. The miR-182 and miR-141/200a binding sites that are conserved across mammalian species are indicated, and mutations experimentally introduced into the sequences are shown in red. C, GNA13–3′-UTR activity in different cell types. The indicated cells were transduced with miR-Sens-Vector control or miR-Sens-GNA13–3′-UTR, and reporter activity was calculated using Renilla luciferase values normalized to firefly luciferase values (Renilla Luc/Firefly Luc = RLU). Data and statistics were calculated using 9 points (*, p < 0.05). D, expression of specific microRNAs in LnCAP and PC3 cells. Real-time PCR was performed using Qiagen primers specific for microRNAs -182 and -141/200a, and the relative microRNA concentration calculated using the 2−ΔΔCT method relative to the miR-182 level in LnCAP cells (n = 9; *, p < 0.05).