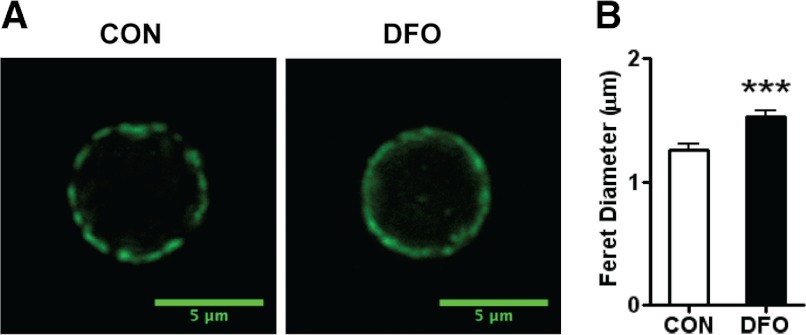
Figure 1. Lipid microdomain organization in B cells from SMAD−/− mice.
(A) Representative fluorescent images of lipid microdomains on purified B cells from SMAD−/− mice fed the CON (left) or DFO (right) diet. Cells were stained with CTxB conjugated to FITC for visualization of clustered GM1 molecules. (B) Lipid microdomain size on a micron scale, measured with the feret's diameter, of purified B cells from SMAD−/− fed the CON (open bar) or DFO (solid bar) diet. Data are represented as mean ± sem; n = 10. Data indicate significant differences between the DFO diet and the CON diet: ***P < 0.001.

